QUESTION IMAGE
Question
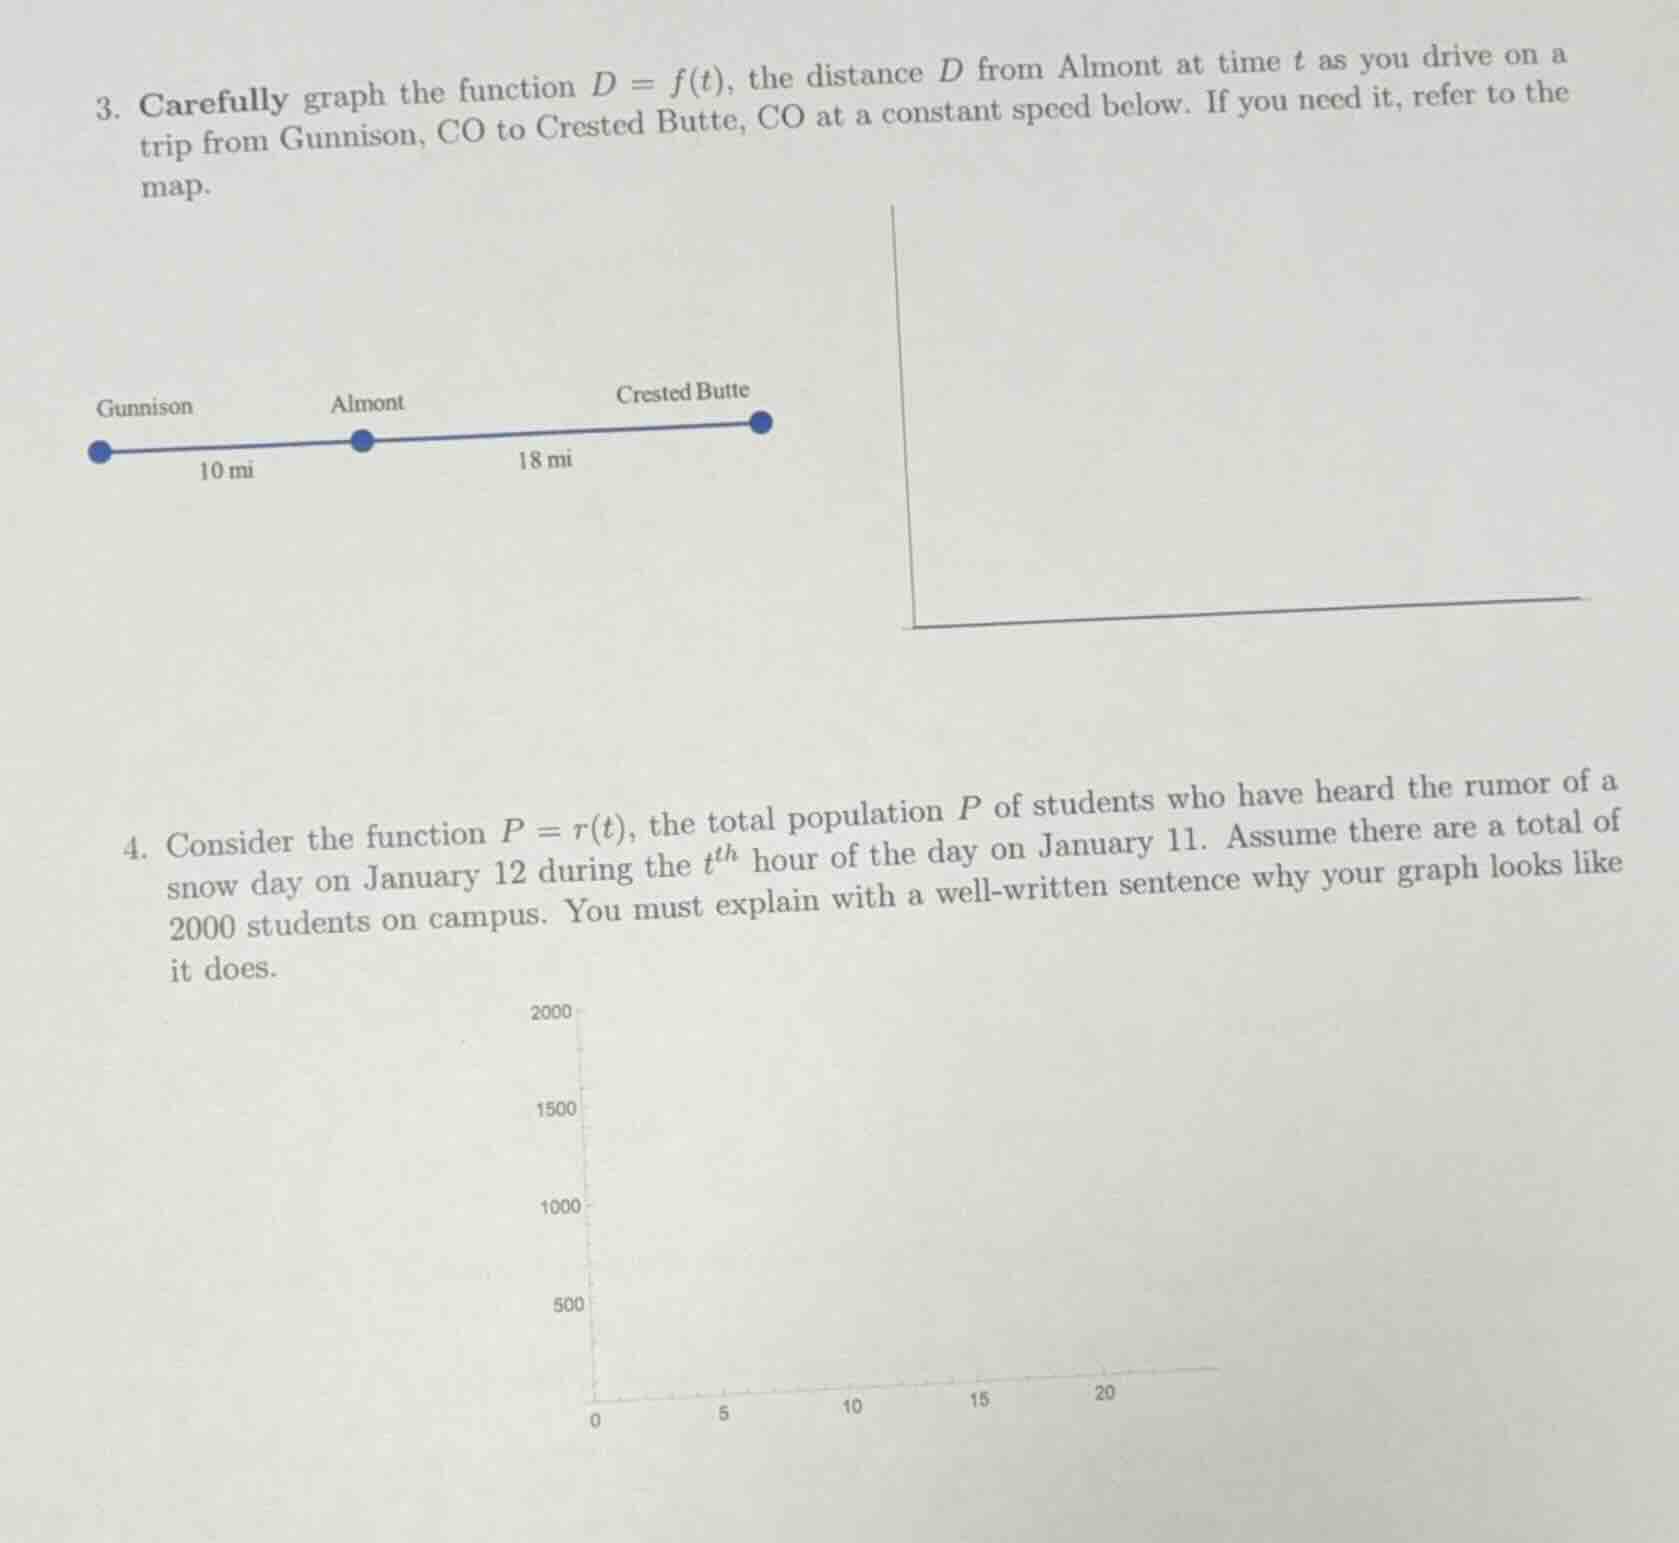
- carefully graph the function $d = f(t)$, the distance $d$ from almont at time $t$ as you drive on a trip from gunnison, co to crested butte, co at a constant speed below. if you need it, refer to the map.
map: gunnison ----10 mi---- almont ----18 mi---- crested butte
- consider the function $p = r(t)$, the total population $p$ of students who have heard the rumor of a snow day on january 12 during the $t^{th}$ hour of the day on january 11. assume there are a total of 2000 students on campus. you must explain with a well - written sentence why your graph looks like it does.
chart for problem 4: y - axis from 0 to 2000, x - axis from 0 to 20
Problem 3: Graphing \( D = f(t) \)
To graph \( D = f(t) \) (distance from Almont over time \( t \)):
- Identify Key Points:
- At \( t = 0 \) (starting at Gunnison), distance from Almont is \( 10 \) miles (since Gunnison to Almont is \( 10 \) mi).
- As time increases, we drive toward Crested Butte, so distance from Almont increases at constant speed (since speed is constant). The total distance from Almont to Crested Butte is \( 18 \) miles, so the graph will be a linear segment (constant slope) starting at \( (0, 10) \) and ending at \( (t_{\text{total}}, 10 + 18) = (t_{\text{total}}, 28) \), where \( t_{\text{total}} = \frac{\text{total distance}}{\text{speed}} \). However, since speed is constant, the graph is a straight line with positive slope.
Problem 4: Graphing \( P = r(t) \) (Rumor Spread)
To graph \( P = r(t) \) (total students who heard the rumor over time \( t \)):
- Understand Rumor Spread Dynamics:
Rumor spread typically follows a logistic growth pattern (or exponential growth initially, then saturation). Since there are \( 2000 \) students total, the graph starts at \( P = 0 \) (no one has heard the rumor at \( t = 0 \)) and increases over time, approaching \( P = 2000 \) (all students hear it). The slope (rate of spread) increases initially (more students hear from others) and then decreases as \( P \) nears \( 2000 \) (fewer new students to inform).
- Graph Shape:
- Start at \( (0, 0) \).
- Curve upward (increasing slope) initially, then curve downward (decreasing slope) as \( P \) approaches \( 2000 \), forming an S - shaped (logistic) curve. The explanation: "The graph of \( P = r(t) \) is an S - shaped (logistic) curve starting at \( (0, 0) \) and approaching \( P = 2000 \) because rumor spread accelerates as more students hear it (increasing slope initially) and slows as most students have already heard it (decreasing slope near saturation), with a maximum of \( 2000 \) students."
Final Answers (Graph Descriptions)
Problem 3 Graph:
A linear graph with:
- Vertical axis (y - axis): Distance from Almont (miles), labeled \( D \).
- Horizontal axis (x - axis): Time (hours), labeled \( t \).
- Starting point: \( (0, 10) \) (at \( t = 0 \), 10 miles from Almont).
- Ending point: \( (t_{\text{total}}, 28) \) (when arriving at Crested Butte, 28 miles from Almont), with a constant positive slope (since speed is constant).
Problem 4 Graph:
A logistic (S - shaped) curve with:
- Vertical axis (y - axis): Number of students \( P \), labeled \( P \).
- Horizontal axis (x - axis): Time (hours), labeled \( t \).
- Starting point: \( (0, 0) \) (no students have heard the rumor at \( t = 0 \)).
- As \( t \) increases, \( P \) rises toward \( 2000 \), with the curve becoming steeper initially (faster spread) and then less steep (slower spread) as \( P \) nears \( 2000 \), because the rate of new students hearing the rumor increases when few have heard and decreases when most have heard.
(Note: For actual graphing, use graph paper or software to plot these key points and shapes.)

Snap & solve any problem in the app
Get step-by-step solutions on Sovi AI
Photo-based solutions with guided steps
Explore more problems and detailed explanations
To graph \( P = r(t) \) (total students who heard the rumor over time \( t \)):
- Understand Rumor Spread Dynamics:
Rumor spread typically follows a logistic growth pattern (or exponential growth initially, then saturation). Since there are \( 2000 \) students total, the graph starts at \( P = 0 \) (no one has heard the rumor at \( t = 0 \)) and increases over time, approaching \( P = 2000 \) (all students hear it). The slope (rate of spread) increases initially (more students hear from others) and then decreases as \( P \) nears \( 2000 \) (fewer new students to inform).
- Graph Shape:
- Start at \( (0, 0) \).
- Curve upward (increasing slope) initially, then curve downward (decreasing slope) as \( P \) approaches \( 2000 \), forming an S - shaped (logistic) curve. The explanation: "The graph of \( P = r(t) \) is an S - shaped (logistic) curve starting at \( (0, 0) \) and approaching \( P = 2000 \) because rumor spread accelerates as more students hear it (increasing slope initially) and slows as most students have already heard it (decreasing slope near saturation), with a maximum of \( 2000 \) students."
Final Answers (Graph Descriptions)
Problem 3 Graph:
A linear graph with:
- Vertical axis (y - axis): Distance from Almont (miles), labeled \( D \).
- Horizontal axis (x - axis): Time (hours), labeled \( t \).
- Starting point: \( (0, 10) \) (at \( t = 0 \), 10 miles from Almont).
- Ending point: \( (t_{\text{total}}, 28) \) (when arriving at Crested Butte, 28 miles from Almont), with a constant positive slope (since speed is constant).
Problem 4 Graph:
A logistic (S - shaped) curve with:
- Vertical axis (y - axis): Number of students \( P \), labeled \( P \).
- Horizontal axis (x - axis): Time (hours), labeled \( t \).
- Starting point: \( (0, 0) \) (no students have heard the rumor at \( t = 0 \)).
- As \( t \) increases, \( P \) rises toward \( 2000 \), with the curve becoming steeper initially (faster spread) and then less steep (slower spread) as \( P \) nears \( 2000 \), because the rate of new students hearing the rumor increases when few have heard and decreases when most have heard.
(Note: For actual graphing, use graph paper or software to plot these key points and shapes.)