QUESTION IMAGE
Question
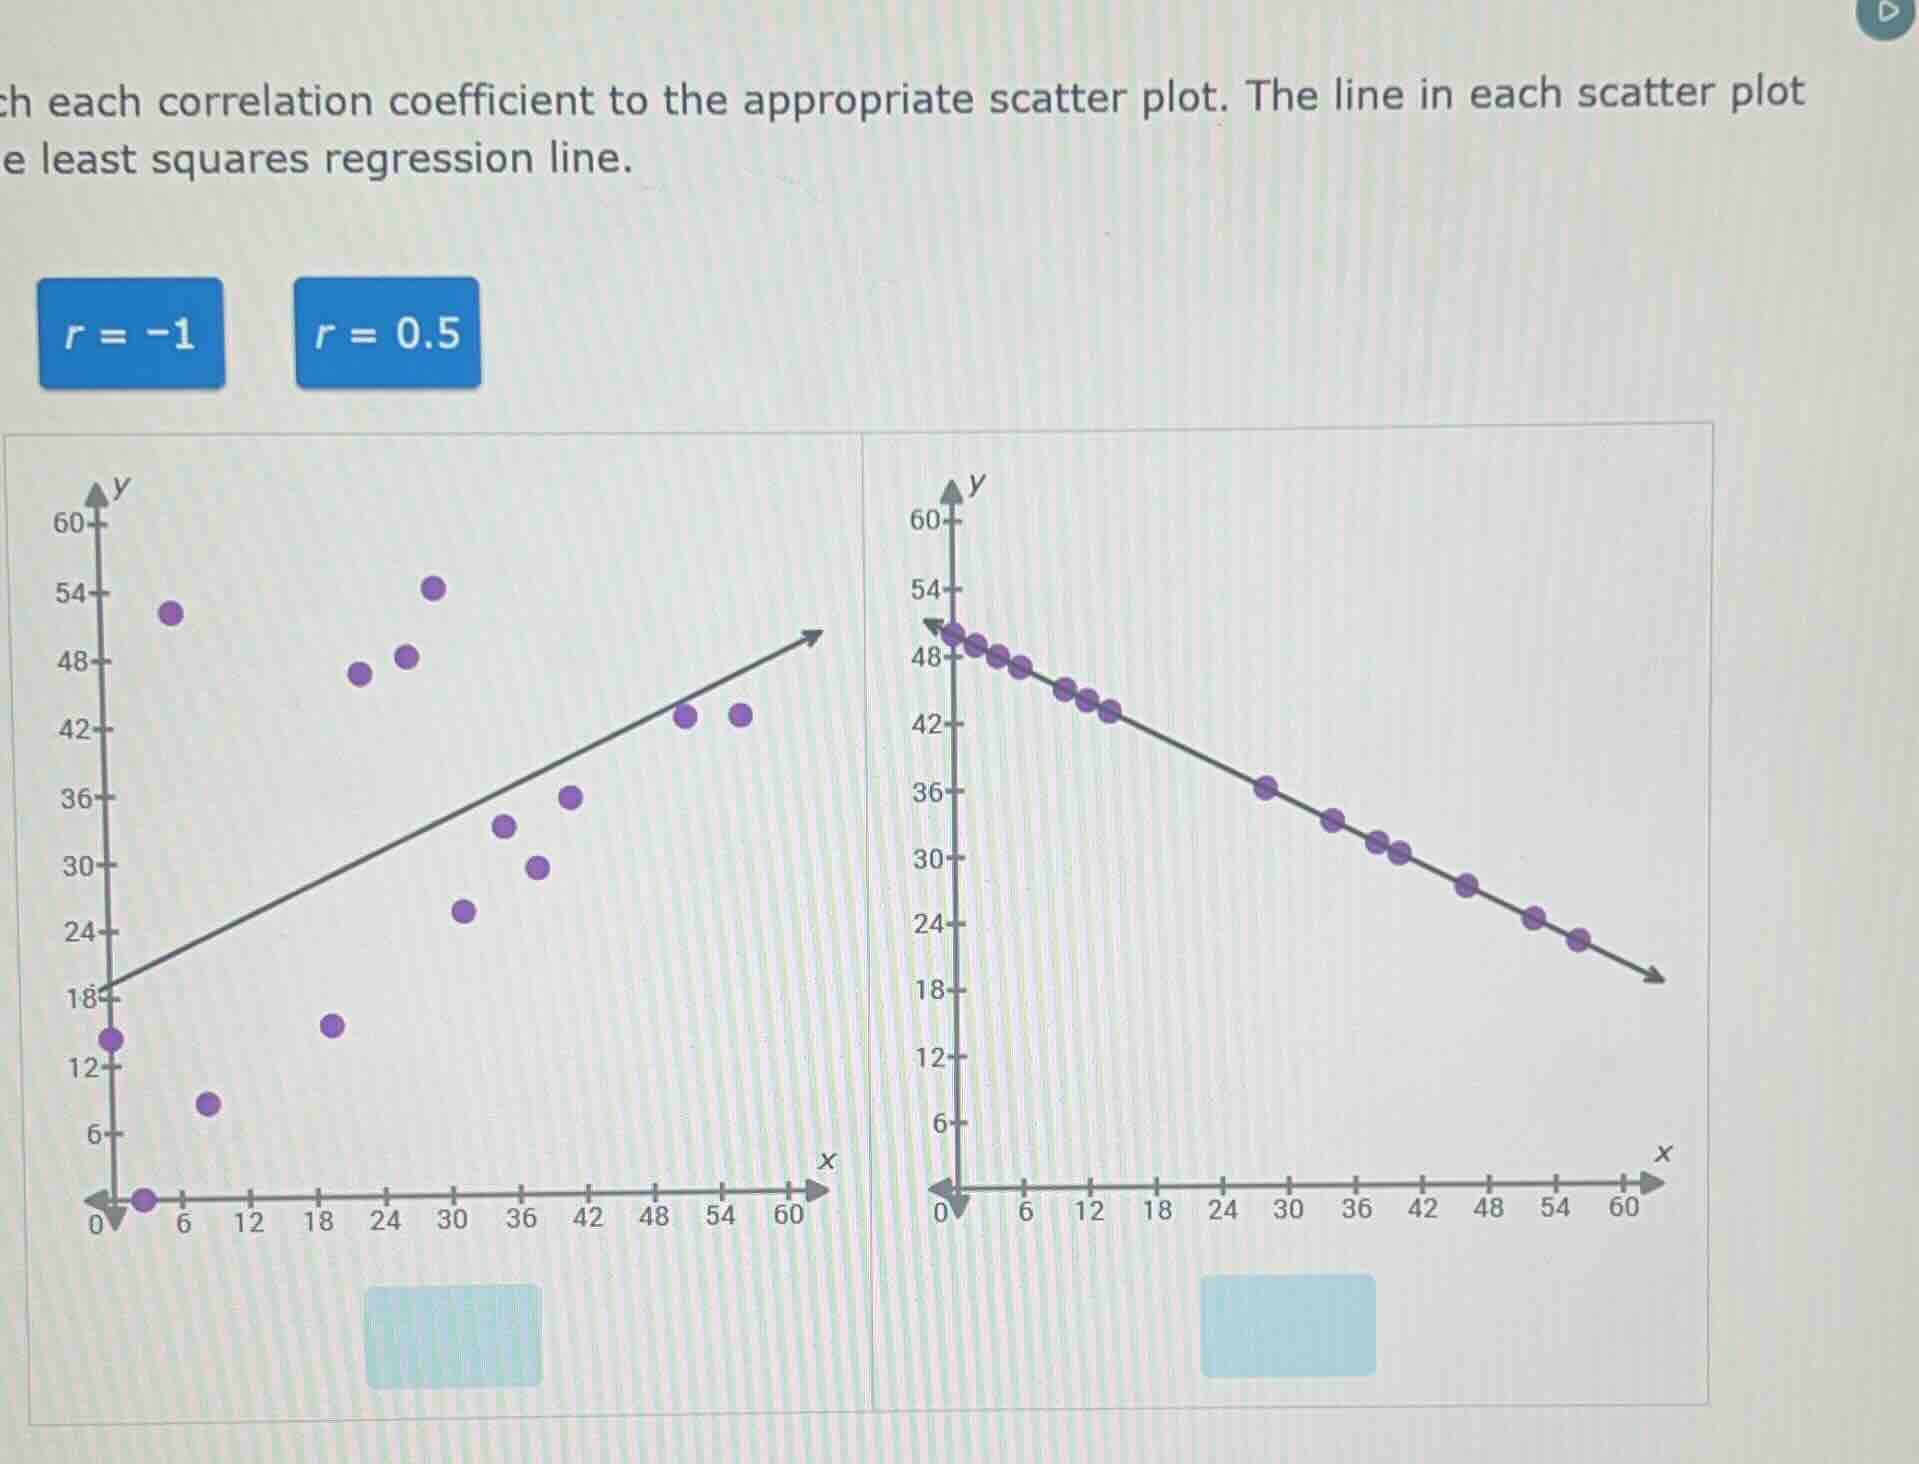
ch each correlation coefficient to the appropriate scatter plot. the line in each scatter plot e least squares regression line.\\(r = -1\\) \\(r = 0.5\\)
Brief Explanations
- For the left scatter plot: The points show a weak positive linear relationship (they loosely follow an upward trend but are not tightly clustered on the regression line). A correlation coefficient of \(r=0.5\) represents a moderate positive linear association, which matches this plot.
- For the right scatter plot: All points lie perfectly on a downward-sloping straight line, meaning there is a perfect negative linear relationship. A correlation coefficient of \(r=-1\) defines a perfect negative linear association, which matches this plot.

Snap & solve any problem in the app
Get step-by-step solutions on Sovi AI
Photo-based solutions with guided steps
Explore more problems and detailed explanations
Left scatter plot: \(r = 0.5\)
Right scatter plot: \(r = -1\)