QUESTION IMAGE
Question
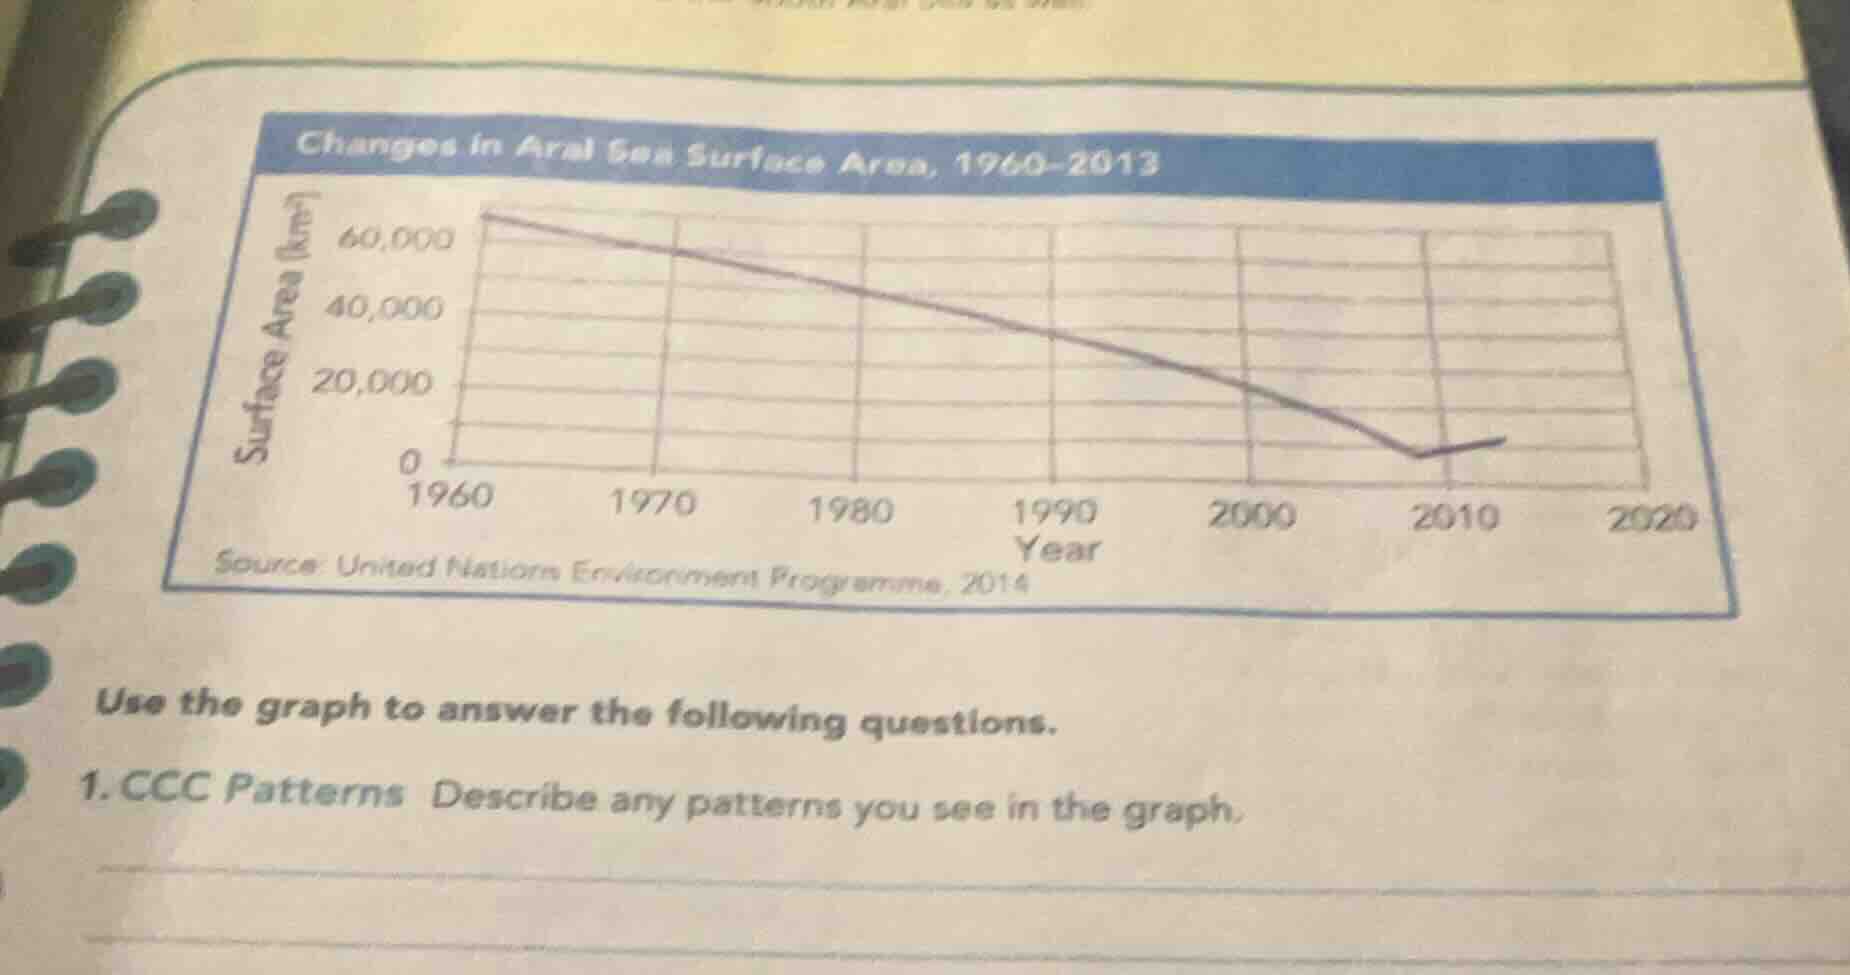
changes in aral sea surface area, 1960-2013
source: united nations environment programme, 2014
use the graph to answer the following questions.
- ccc patterns describe any patterns you see in the graph.
The line graph tracks the Aral Sea's surface area over 1960-2013. From 1960 to around 2010, there is a consistent, steady downward trend in surface area, dropping from ~60,000 km² to near 0 km². After 2010, the area shows a very small, slight upward plateau, but remains at a very low level.

Snap & solve any problem in the app
Get step-by-step solutions on Sovi AI
Photo-based solutions with guided steps
Explore more problems and detailed explanations
From 1960 to approximately 2010, the surface area of the Aral Sea experiences a continuous, steep downward trend, decreasing from around 60,000 km² to nearly 0 km². Following 2010, the surface area stabilizes at a very low level with a tiny, minor upward shift, but stays far below its original 1960 size.