QUESTION IMAGE
Question
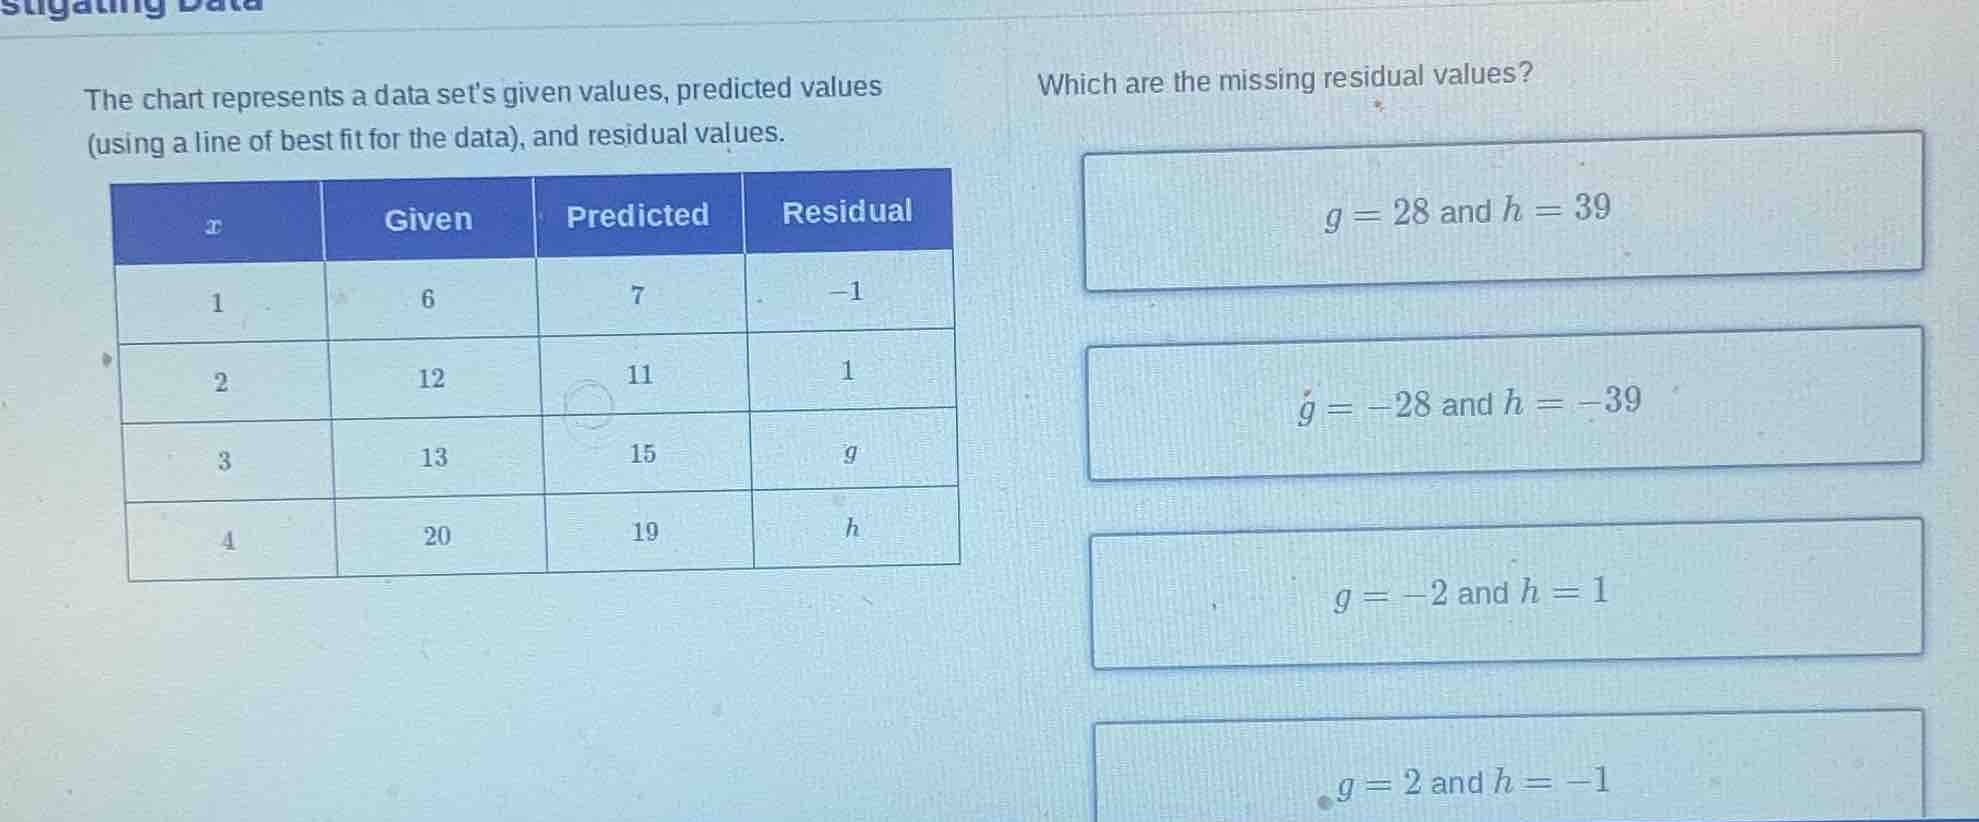
the chart represents a data sets given values, predicted values (using a line of best fit for the data), and residual values. which are the missing residual values? the table has columns x, given, predicted, residual. rows: x=1, given=6, predicted=7, residual=-1; x=2, given=12, predicted=11, residual=1; x=3, given=13, predicted=15, residual=g; x=4, given=20, predicted=19, residual=h. options: g = 28 and h = 39; g = -28 and h = -39; g = -2 and h = 1; g = 2 and h = -1
Step1: Recall residual formula
Residual = Given - Predicted
Step2: Calculate g (x=3)
Given = 13, Predicted = 15
$g = 13 - 15 = -2$
Step3: Calculate h (x=4)
Given = 20, Predicted = 19
$h = 20 - 19 = 1$

Snap & solve any problem in the app
Get step-by-step solutions on Sovi AI
Photo-based solutions with guided steps
Explore more problems and detailed explanations
\( g = -2 \) and \( h = 1 \) (corresponding to the option " \( g = -2 \) and \( h = 1 \) ")