QUESTION IMAGE
Question
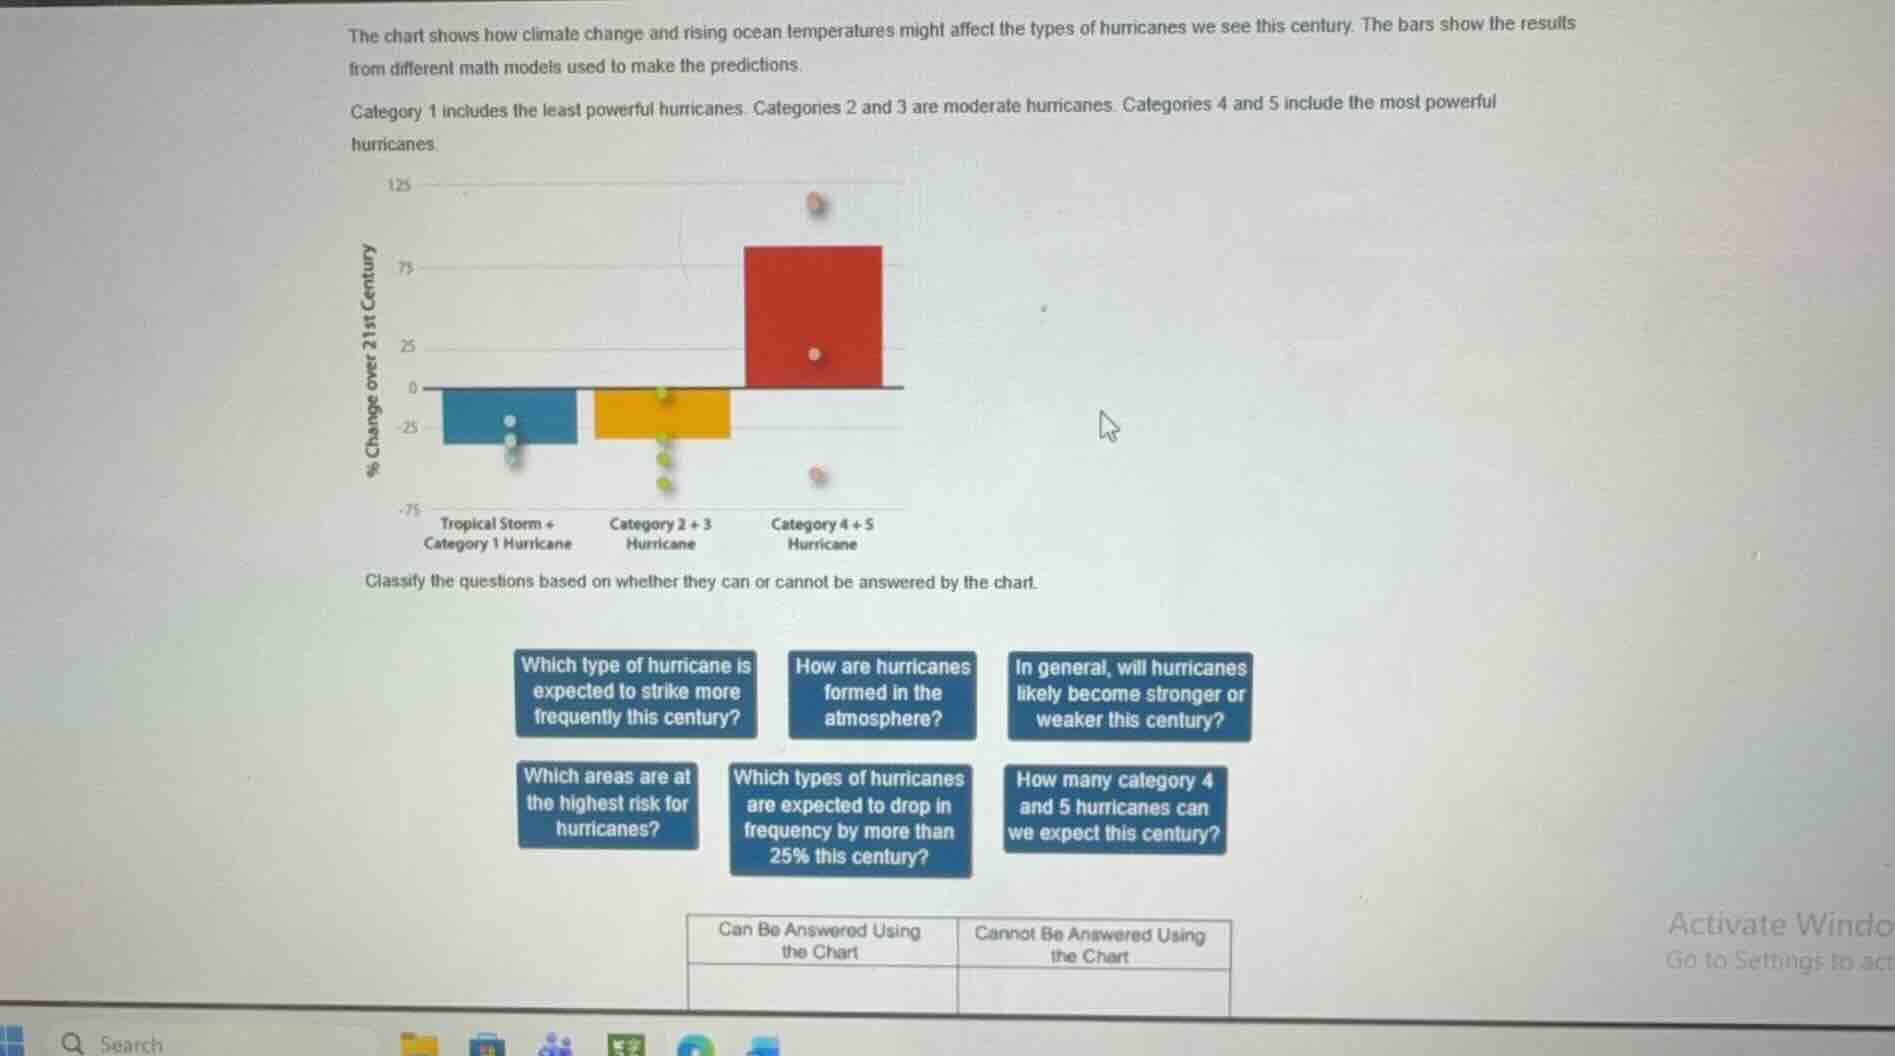
the chart shows how climate change and rising ocean temperatures might affect the types of hurricanes we see this century. the bars show the results from different math models used to make the predictions.
category 1 includes the least powerful hurricanes. categories 2 and 3 are moderate hurricanes. categories 4 and 5 include the most powerful hurricanes.
% change over 21st century
tropical storm + category 1 hurricane
category 2 + 3 hurricane
category 4 + 5 hurricane
classify the questions based on whether they can or cannot be answered by the chart.
which type of hurricane is expected to strike more frequently this century?
how are hurricanes formed in the atmosphere?
in general, will hurricanes likely become stronger or weaker this century?
which areas are at the highest risk for hurricanes?
which types of hurricanes are expected to drop in frequency by more than 25% this century?
how many category 4 and 5 hurricanes can we expect this century?
can be answered using the chart
cannot be answered using the chart
- Can Be Answered Using the Chart:
- Which type of hurricane is expected to strike more frequently this century?: The chart shows Category 4+5 hurricanes have a positive % change, meaning increased frequency.
- In general, will hurricanes likely become stronger or weaker this century?: Stronger (Category 4+5) hurricanes increase, while weaker/moderate ones decrease, indicating a shift to stronger hurricanes.
- Which types of hurricanes are expected to drop in frequency by more than 25% this century?: The chart shows Category 2+3 hurricanes have a % change below -25, and some models for Tropical Storm+Category 1 also fall below -25.
- Cannot Be Answered Using the Chart:
- How are hurricanes formed in the atmosphere?: The chart only shows frequency changes, not formation mechanisms.
- Which areas are at the highest risk for hurricanes?: The chart does not include geographic location data.
- How many category 4 and 5 hurricanes can we expect this century?: The chart only shows percentage change, not absolute numbers.

Snap & solve any problem in the app
Get step-by-step solutions on Sovi AI
Photo-based solutions with guided steps
Explore more problems and detailed explanations
Can Be Answered Using the Chart
- Which type of hurricane is expected to strike more frequently this century?
- In general, will hurricanes likely become stronger or weaker this century?
- Which types of hurricanes are expected to drop in frequency by more than 25% this century?
Cannot Be Answered Using the Chart
- How are hurricanes formed in the atmosphere?
- Which areas are at the highest risk for hurricanes?
- How many category 4 and 5 hurricanes can we expect this century?