QUESTION IMAGE
Question
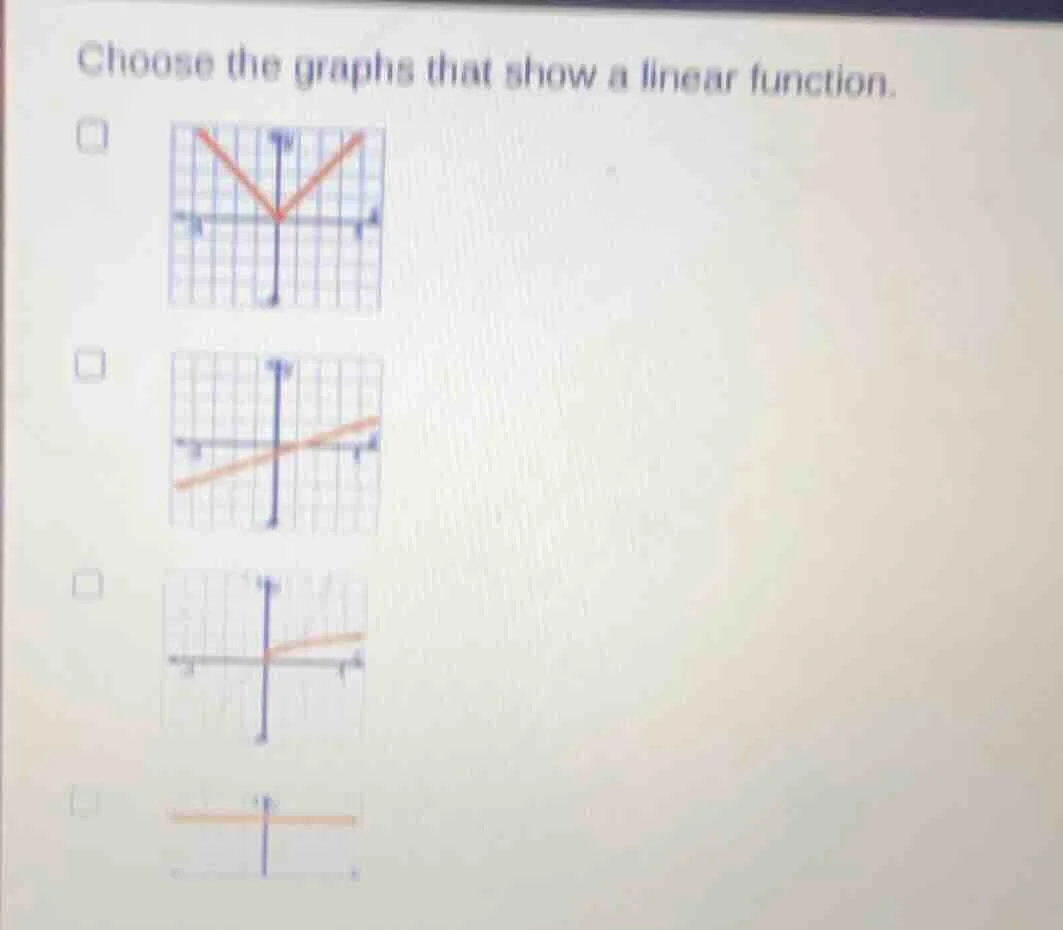
choose the graphs that show a linear function.
To determine which graphs represent linear functions, we recall that a linear function has the form \( y = mx + b \), where \( m \) (slope) and \( b \) (y - intercept) are constants, and its graph is a straight line. Also, we can use the vertical line test to check if it is a function (a vertical line should intersect the graph at most once).
Analyzing each graph:
- First graph (V - shaped):
- This graph is a V - shape, which is the graph of an absolute - value function (\(y=\vert x\vert\) or a transformation of it). It is not a straight line, so it does not represent a linear function. Also, for the purpose of being a function, it passes the vertical line test, but since it is not a straight line, it is not a linear function.
- Second graph (Straight line with non - zero slope):
- This graph is a straight line. When we apply the vertical line test, a vertical line will intersect this graph at most once, so it is a function. And since it is a straight line, it represents a linear function of the form \(y = mx + b\) where \(m
eq0\).
- Third graph (Straight line with non - zero slope):
- This graph is a straight line. When we apply the vertical line test, a vertical line will intersect this graph at most once, so it is a function. And since it is a straight line, it represents a linear function of the form \(y=mx + b\) where \(m
eq0\).
- Fourth graph (Horizontal line):
- A horizontal line has the equation \(y = b\) (where \(m = 0\) in the linear function form \(y=mx + b\)). It is a straight line, and when we apply the vertical line test, a vertical line will intersect this graph at most once, so it is a function and it is a linear function.
So the graphs that show a linear function are the second, third, and fourth graphs (assuming the fourth graph is a horizontal line which is a special case of a linear function with \(m = 0\)). If we consider the options as checkboxes:
- The second graph (the one with a non - vertical, non - horizontal straight line with a non - zero slope) should be checked.
- The third graph (the one with a non - vertical, non - horizontal straight line with a non - zero slope) should be checked.
- The fourth graph (the horizontal line) should be checked.
If we assume the fourth graph is a horizontal line (which is a linear function \(y = b\), \(m = 0\)):
The graphs that represent linear functions are the second, third, and fourth ones.
If we were to list the checkboxes (assuming the first checkbox is for the V - shaped graph, the second for the non - horizontal non - vertical straight line, the third for the other non - horizontal non - vertical straight line, and the fourth for the horizontal line):
- Check the second checkbox.
- Check the third checkbox.
- Check the fourth checkbox.

Snap & solve any problem in the app
Get step-by-step solutions on Sovi AI
Photo-based solutions with guided steps
Explore more problems and detailed explanations
To determine which graphs represent linear functions, we recall that a linear function has the form \( y = mx + b \), where \( m \) (slope) and \( b \) (y - intercept) are constants, and its graph is a straight line. Also, we can use the vertical line test to check if it is a function (a vertical line should intersect the graph at most once).
Analyzing each graph:
- First graph (V - shaped):
- This graph is a V - shape, which is the graph of an absolute - value function (\(y=\vert x\vert\) or a transformation of it). It is not a straight line, so it does not represent a linear function. Also, for the purpose of being a function, it passes the vertical line test, but since it is not a straight line, it is not a linear function.
- Second graph (Straight line with non - zero slope):
- This graph is a straight line. When we apply the vertical line test, a vertical line will intersect this graph at most once, so it is a function. And since it is a straight line, it represents a linear function of the form \(y = mx + b\) where \(m
eq0\).
- Third graph (Straight line with non - zero slope):
- This graph is a straight line. When we apply the vertical line test, a vertical line will intersect this graph at most once, so it is a function. And since it is a straight line, it represents a linear function of the form \(y=mx + b\) where \(m
eq0\).
- Fourth graph (Horizontal line):
- A horizontal line has the equation \(y = b\) (where \(m = 0\) in the linear function form \(y=mx + b\)). It is a straight line, and when we apply the vertical line test, a vertical line will intersect this graph at most once, so it is a function and it is a linear function.
So the graphs that show a linear function are the second, third, and fourth graphs (assuming the fourth graph is a horizontal line which is a special case of a linear function with \(m = 0\)). If we consider the options as checkboxes:
- The second graph (the one with a non - vertical, non - horizontal straight line with a non - zero slope) should be checked.
- The third graph (the one with a non - vertical, non - horizontal straight line with a non - zero slope) should be checked.
- The fourth graph (the horizontal line) should be checked.
If we assume the fourth graph is a horizontal line (which is a linear function \(y = b\), \(m = 0\)):
The graphs that represent linear functions are the second, third, and fourth ones.
If we were to list the checkboxes (assuming the first checkbox is for the V - shaped graph, the second for the non - horizontal non - vertical straight line, the third for the other non - horizontal non - vertical straight line, and the fourth for the horizontal line):
- Check the second checkbox.
- Check the third checkbox.
- Check the fourth checkbox.