QUESTION IMAGE
Question
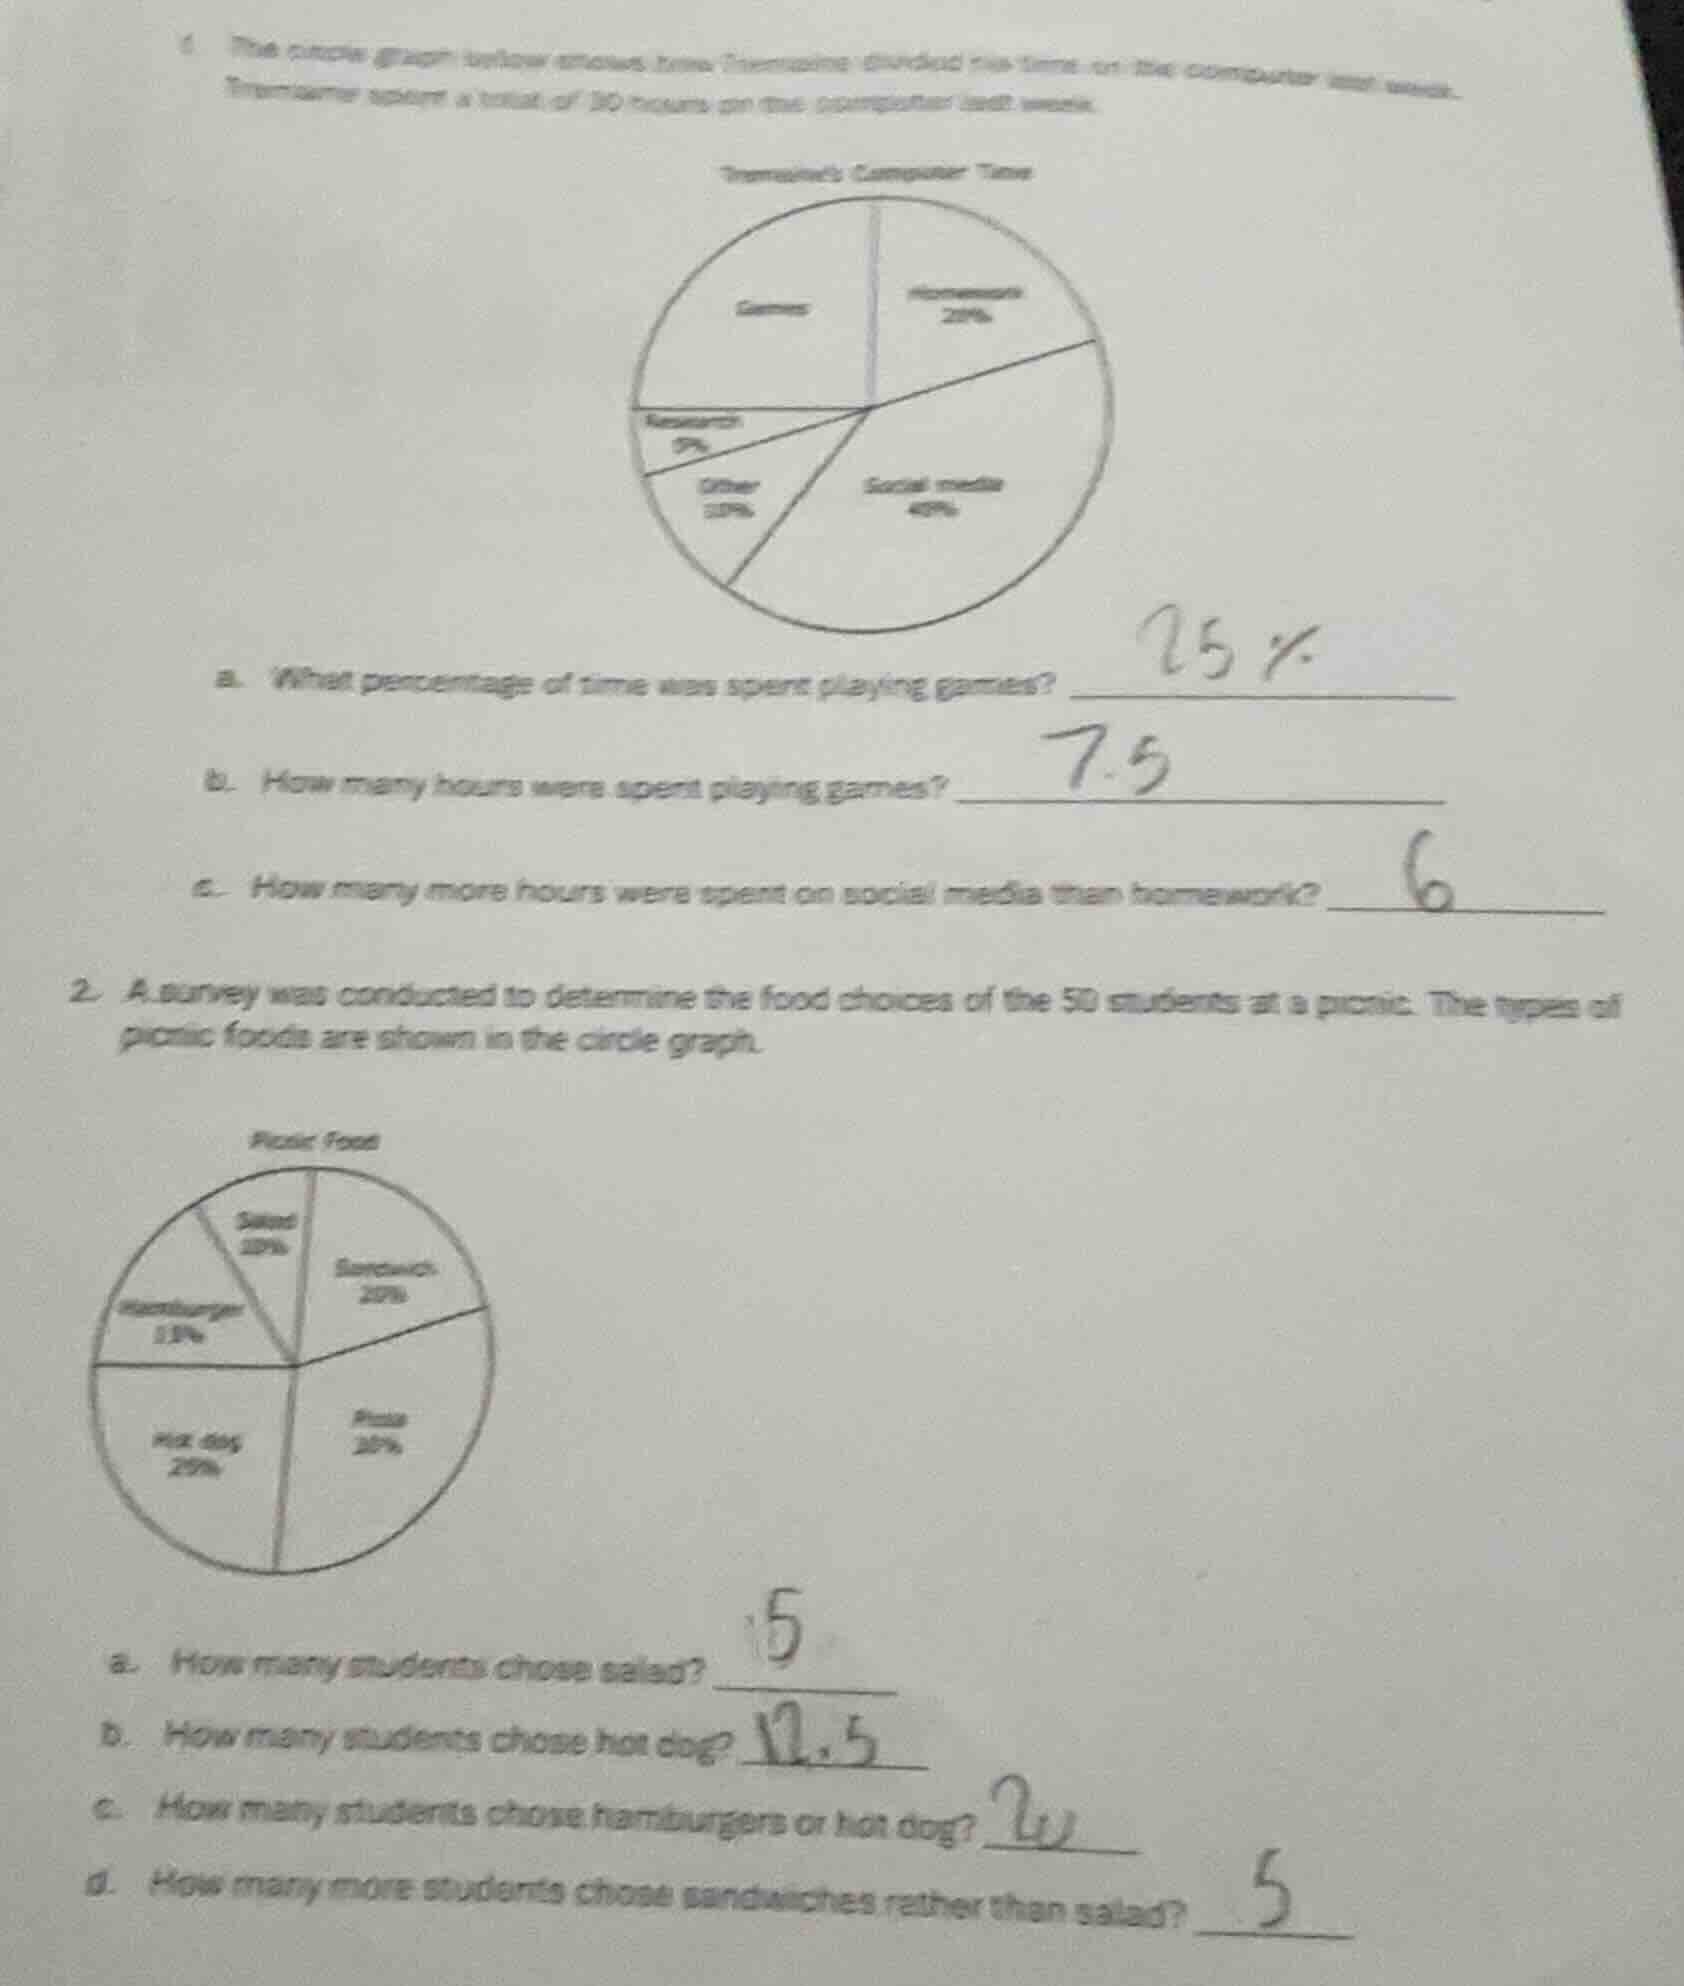
1 the circle graph below shows how tremaine divided his time on the computer last week. tremaine spent a total of 30 hours on the computer last week.
tremaines computer time
a. what percentage of time was spent playing games?
b. how many hours were spent playing games?
c. how many more hours were spent on social media than homework?
- a survey was conducted to determine the food choices of the 50 students at a picnic. the types of picnic foods are shown in the circle graph.
picnic food
a. how many students chose salad?
b. how many students chose hot dog?
c. how many students chose hamburgers or hot dog?
d. how many more students chose sandwiches rather than salad?
Response
Problem 1 (Tremaine's Computer Time)
Part a
Step1: Recall total percentage in a circle graph is 100%.
Step2: Sum known percentages: \(20\% + 40\% + 10\% + 5\% = 75\%\)
Step3: Subtract from 100%: \(100\% - 75\% = 25\%\)
Step1: Total hours = 30, percentage for games = 25% = 0.25.
Step2: Calculate hours: \(30 \times 0.25 = 7.5\)
Step1: Percentage for social media = 40%, homework = 20%. Difference in percentage: \(40\% - 20\% = 20\% = 0.2\)
Step2: Total hours = 30. Calculate hours: \(30 \times 0.2 = 6\)

Snap & solve any problem in the app
Get step-by-step solutions on Sovi AI
Photo-based solutions with guided steps
Explore more problems and detailed explanations
\(25\%\)