QUESTION IMAGE
Question
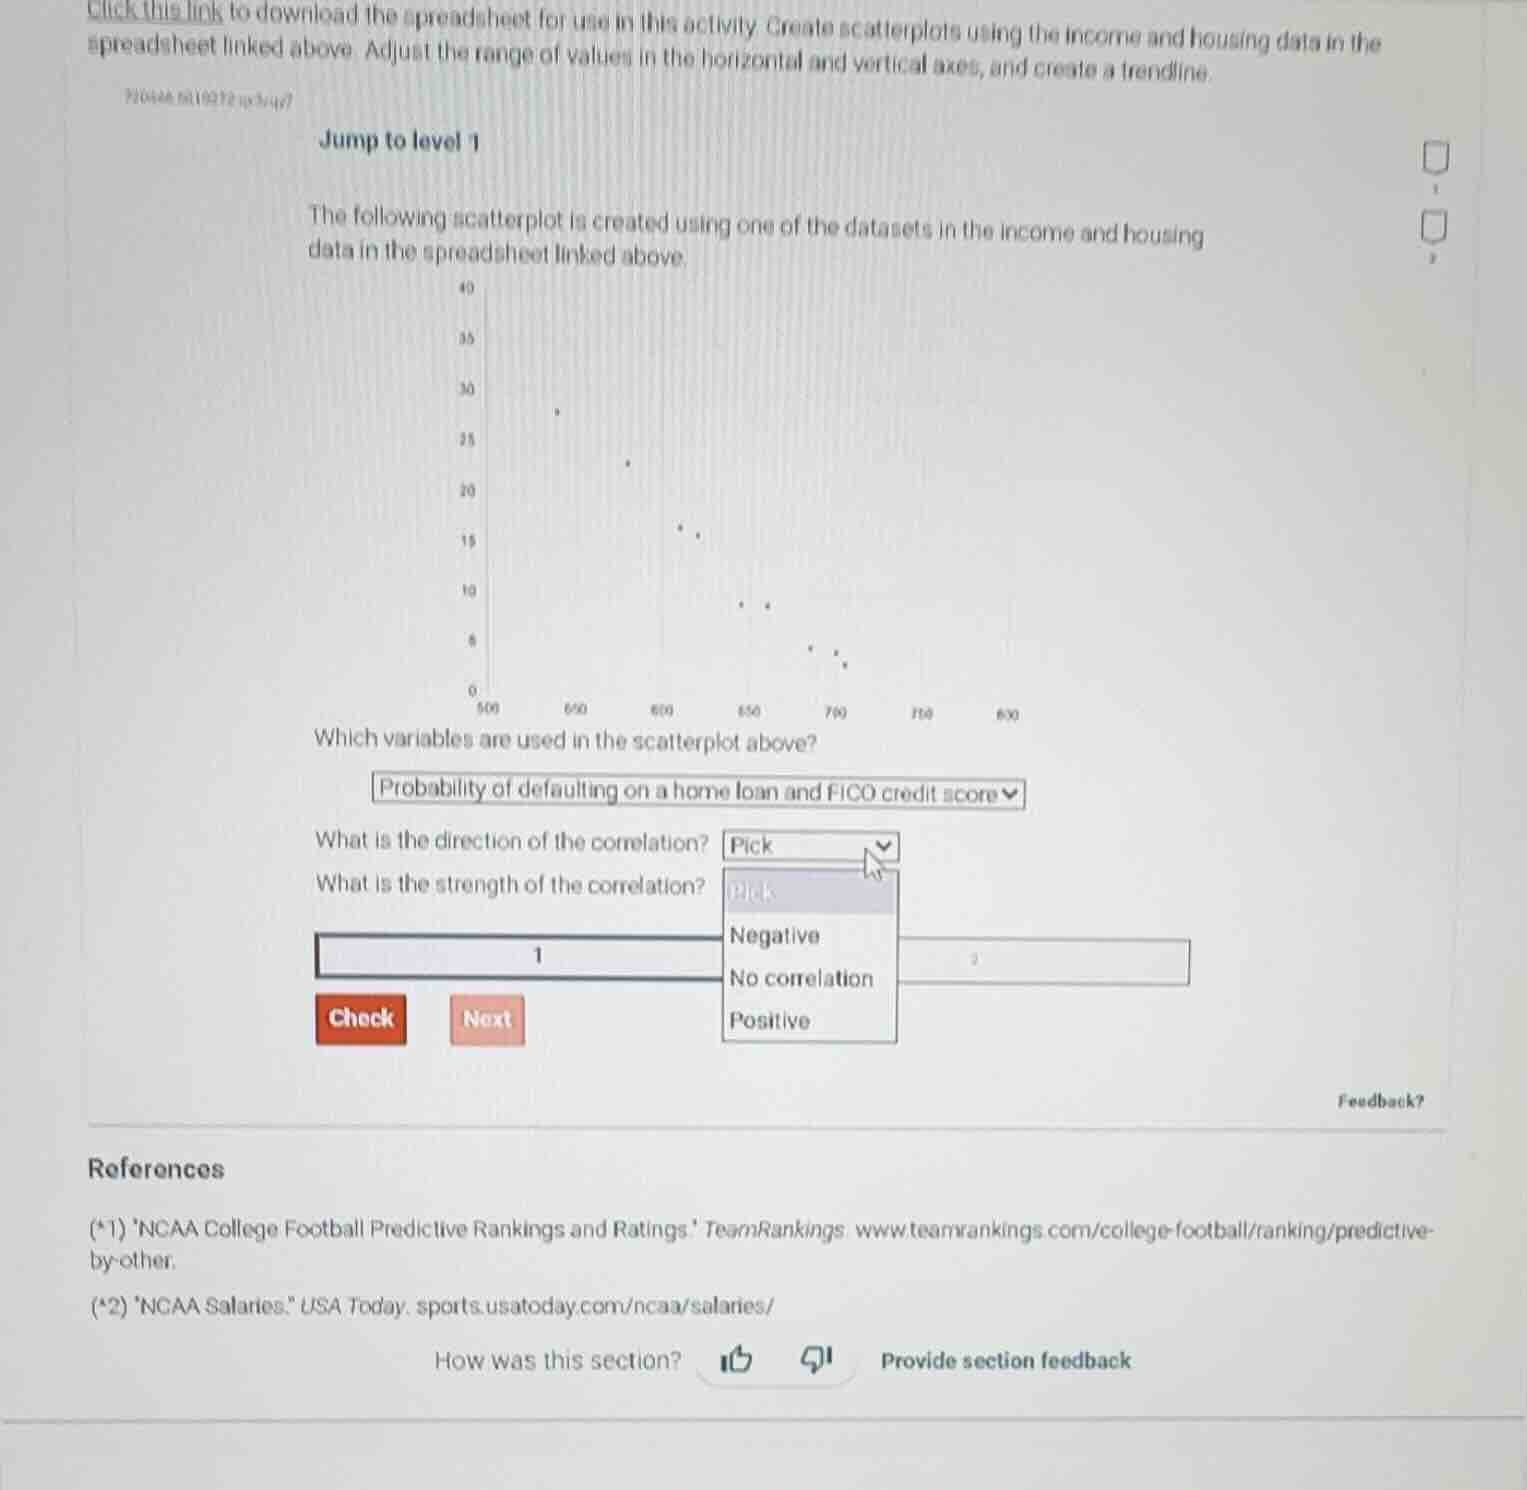
click this link to download the spreadsheet for use in this activity. create scatterplots using the income and housing data in the spreadsheet linked above. adjust the range of values in the horizontal and vertical axes, and create a trendline. jump to level 1 the following scatterplot is created using one of the datasets in the income and housing data in the spreadsheet linked above. which variables are used in the scatterplot above? probability of defaulting on a home loan and fico credit score what is the direction of the correlation? pick what is the strength of the correlation? pick (options for direction: negative, no correlation, positive)
- For correlation direction: As the FICO credit score (horizontal axis) increases, the probability of defaulting on a home loan (vertical axis) decreases, which shows a negative relationship.
- For correlation strength: The points follow a clear downward trend with little scatter, indicating a strong correlation.

Snap & solve any problem in the app
Get step-by-step solutions on Sovi AI
Photo-based solutions with guided steps
Explore more problems and detailed explanations
- What is the direction of the correlation? Negative
- What is the strength of the correlation? Strong