QUESTION IMAGE
Question
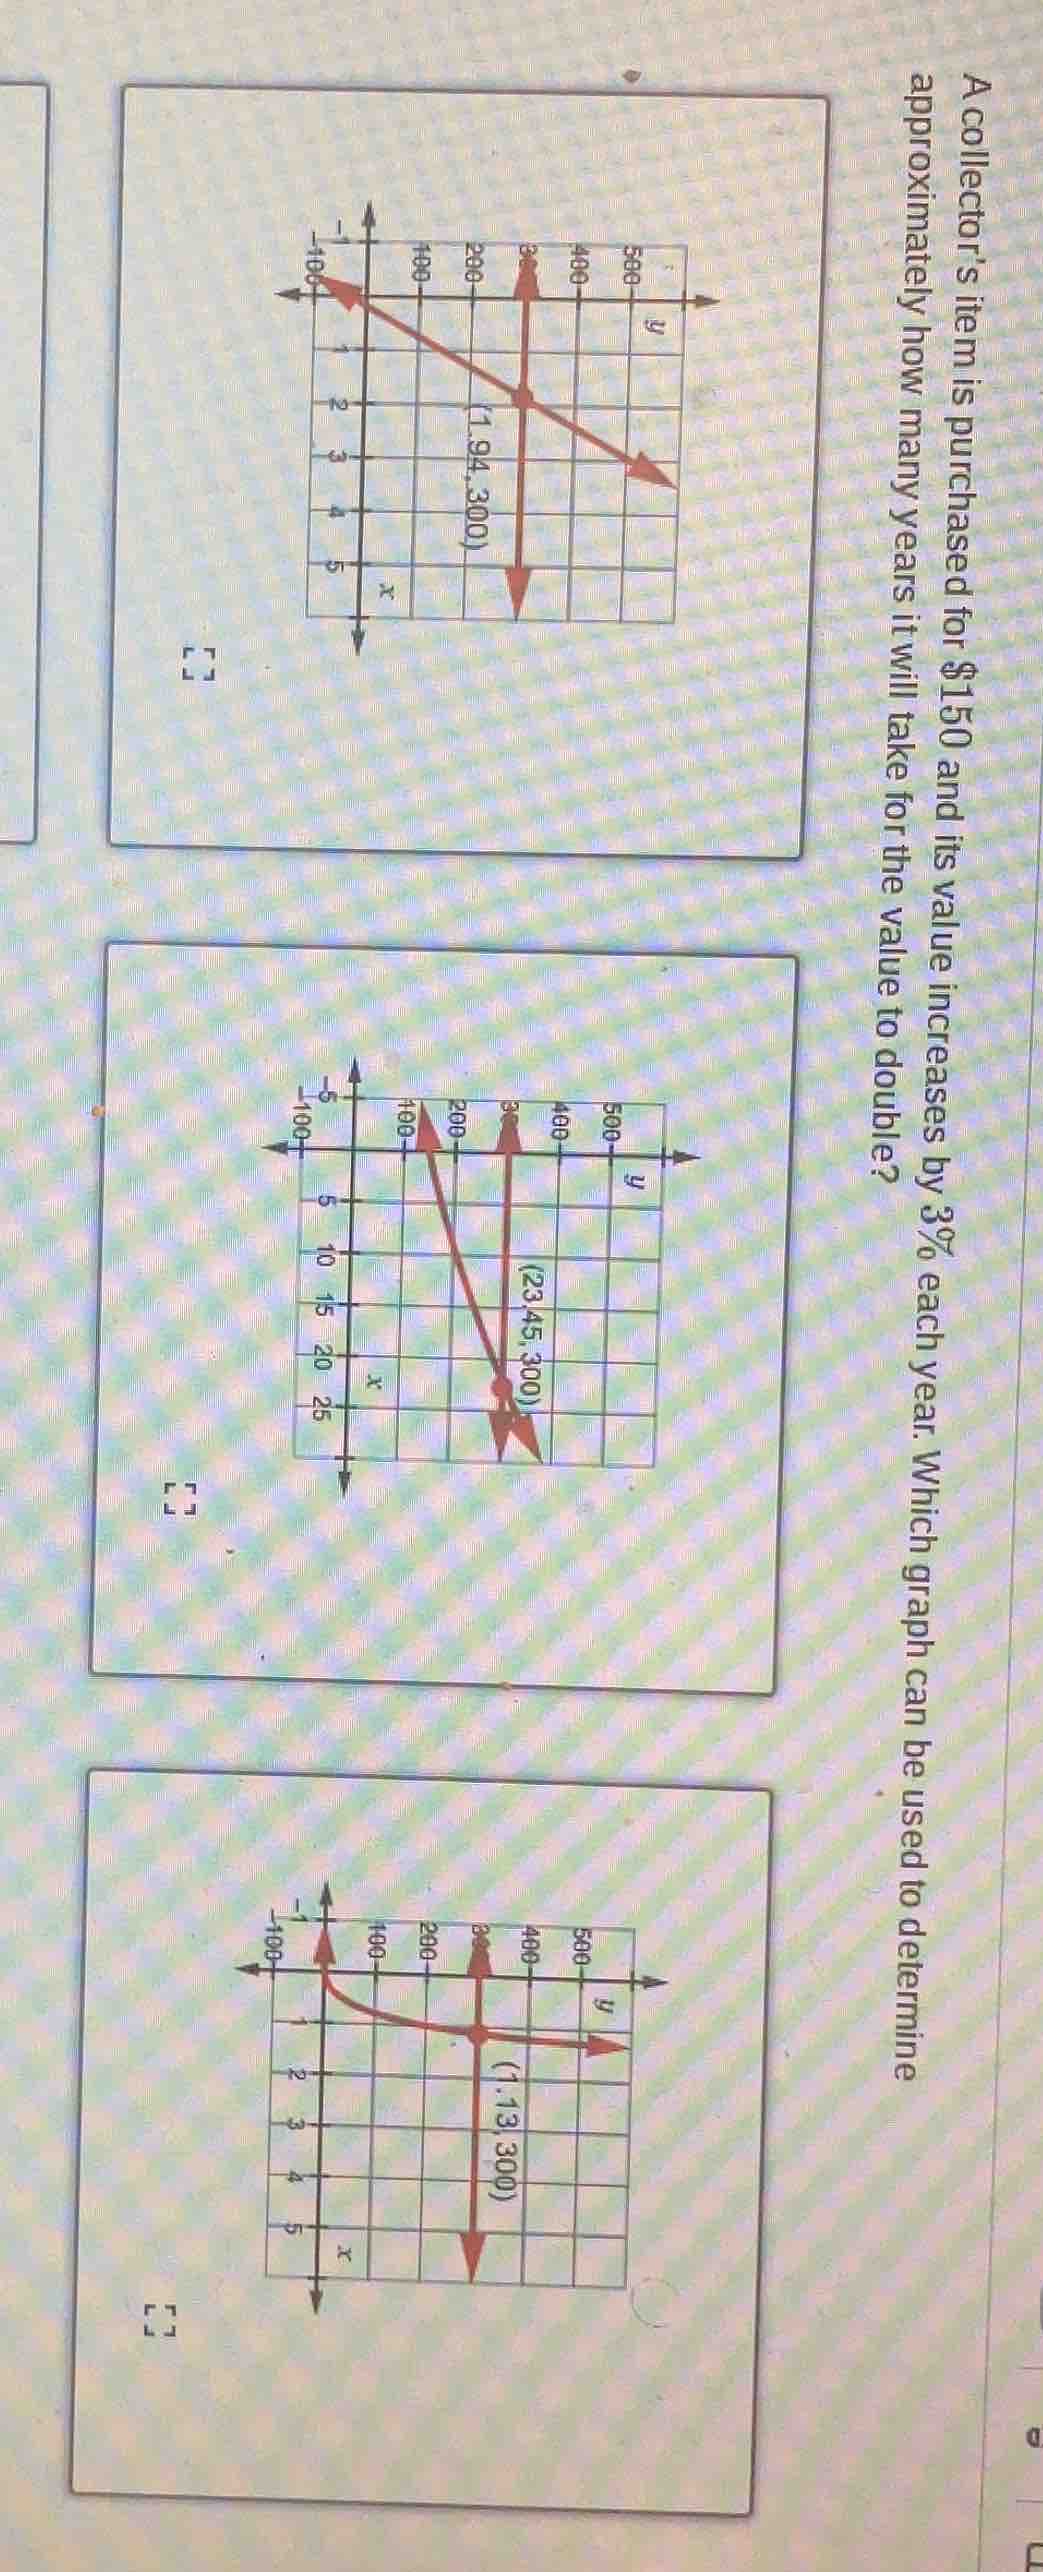
a collector’s item is purchased for $150 and its value increases by 3% each year. which graph can be used to determine approximately how many years it will take for the value to double?
Step1: Define exponential growth formula
The value of the item follows exponential growth: $V(t) = V_0(1+r)^t$, where $V_0=150$, $r=0.03$, and $V(t)=300$ (double the initial value).
Step2: Set up equation for doubled value
$$300 = 150(1+0.03)^t$$
Step3: Simplify the equation
Divide both sides by 150: $2 = (1.03)^t$
Step4: Solve for t using logarithms
Take natural log of both sides: $\ln(2) = t\ln(1.03)$, so $t = \frac{\ln(2)}{\ln(1.03)}$
Step5: Calculate t
$t \approx \frac{0.6931}{0.0296} \approx 23.45$
Step6: Match to correct graph
The graph with the point $(23.45, 300)$ (middle graph) corresponds to this result, as exponential growth curves upward over longer time.

Snap & solve any problem in the app
Get step-by-step solutions on Sovi AI
Photo-based solutions with guided steps
Explore more problems and detailed explanations
It will take approximately 23.45 years for the value to double, and the correct graph is the middle one with the point $(23.45, 300)$.