QUESTION IMAGE
Question
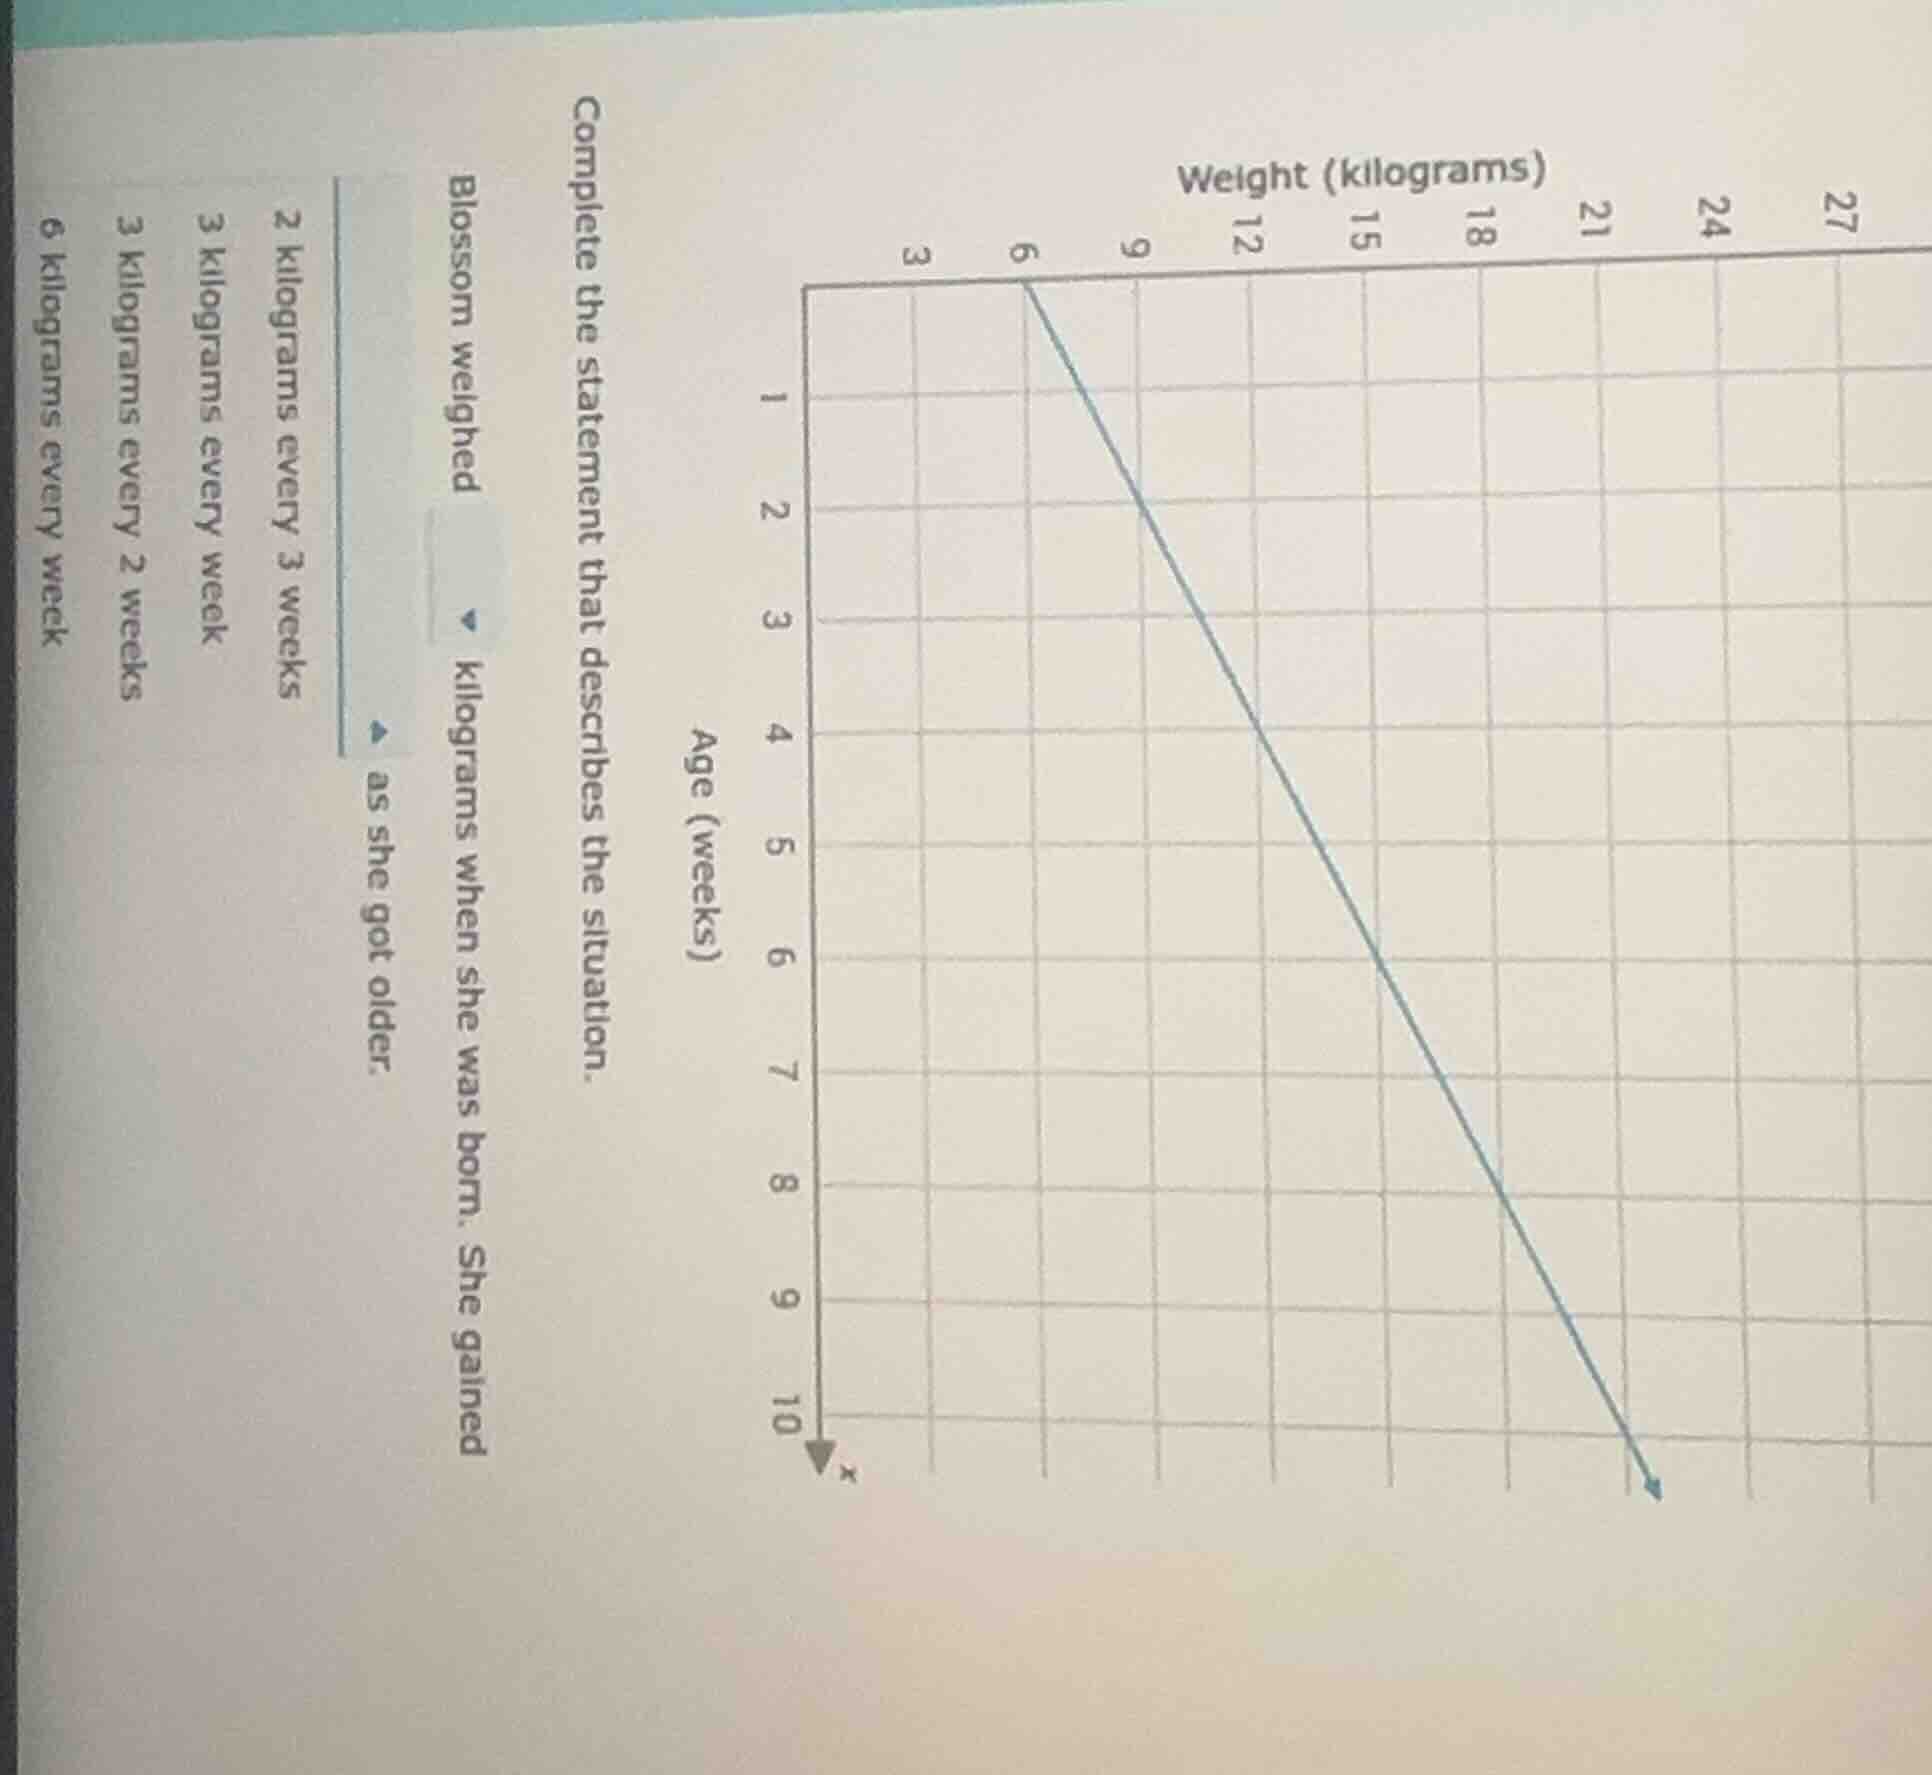
complete the statement that describes the situation.
blossom weighed
kilograms when she was born. she gained
as she got older.
2 kilograms every 3 weeks
3 kilograms every week
3 kilograms every 2 weeks
6 kilograms every week
Step1: Determine birth weight
When Blossom was born, her age (x - value) is 0 weeks. Looking at the graph, when x = 0 (extrapolating the line), the weight (y - value) is 6 kilograms. So she weighed 6 kilograms at birth.
Step2: Calculate weight gain rate
We can take two points on the line. Let's take (0, 6) and (3, 12) (wait, no, looking at the graph, when x = 1 week? Wait, no, the x - axis is age in weeks, starting from 0? Wait, the graph has x from 0 (birth) to 10 weeks? Wait, the first point is at x = 0 (birth) with weight 6 kg? Wait, no, looking at the graph, the line starts at (0, 6)? Wait, no, the grid: when x = 0 (age 0 weeks), the weight is 6 kg. Then, when x = 3 weeks, what's the weight? Wait, the graph shows that at x = 0 (birth), weight is 6 kg, and at x = 3 weeks, weight is 12? No, wait the x - axis is age in weeks (from 0 to 10), and y - axis is weight in kg (3, 6, 9, 12,...). Wait, the line goes from (0, 6) to (10, 27)? No, no, the first point is at x = 0 (age 0) with weight 6 kg, and then as x increases (age increases), weight increases. Wait, let's take two points: when x = 0 (age 0), y = 6; when x = 3 (age 3 weeks), y = 12? Wait, no, the graph's x - axis is labeled "Age (weeks)" with x from 0 to 10, and y - axis "Weight (kilograms)" with y from 3 to 27. Wait, the line starts at (0, 6) and goes to (10, 27)? Wait, no, the slope: let's calculate the slope (weight gain per week). The formula for slope $m=\frac{y_2 - y_1}{x_2 - x_1}$. Let's take two points: (0, 6) and (3, 15)? No, wait the graph: when x = 0 (age 0), weight is 6 kg. When x = 3 (age 3 weeks), weight is 15? No, maybe I misread. Wait, the first point on the line is at x = 0 (age 0) with weight 6 kg, and then at x = 3 (age 3 weeks), weight is 15? No, the grid: each square on x - axis is 1 week, y - axis is 3 kg. Wait, the line passes through (0, 6) and (3, 15)? No, slope would be $\frac{15 - 6}{3 - 0}=\frac{9}{3}=3$ kg per week. Wait, but the options are 2 kg every 3 weeks, 3 kg every week, 3 kg every 2 weeks, 6 kg every week. Wait, if at x = 0, weight is 6 kg, and at x = 1 week, weight is 9 kg (since 6 + 3 = 9), at x = 2 weeks, 12 kg, x = 3 weeks, 15 kg. So the weight gain is 3 kg per week (because from x = 0 to x = 1, weight goes from 6 to 9, which is 3 kg increase in 1 week). So she gained 3 kilograms every week.

Snap & solve any problem in the app
Get step-by-step solutions on Sovi AI
Photo-based solutions with guided steps
Explore more problems and detailed explanations
Blossom weighed 6 kilograms when she was born. She gained 3 kilograms every week as she got older.