QUESTION IMAGE
Question
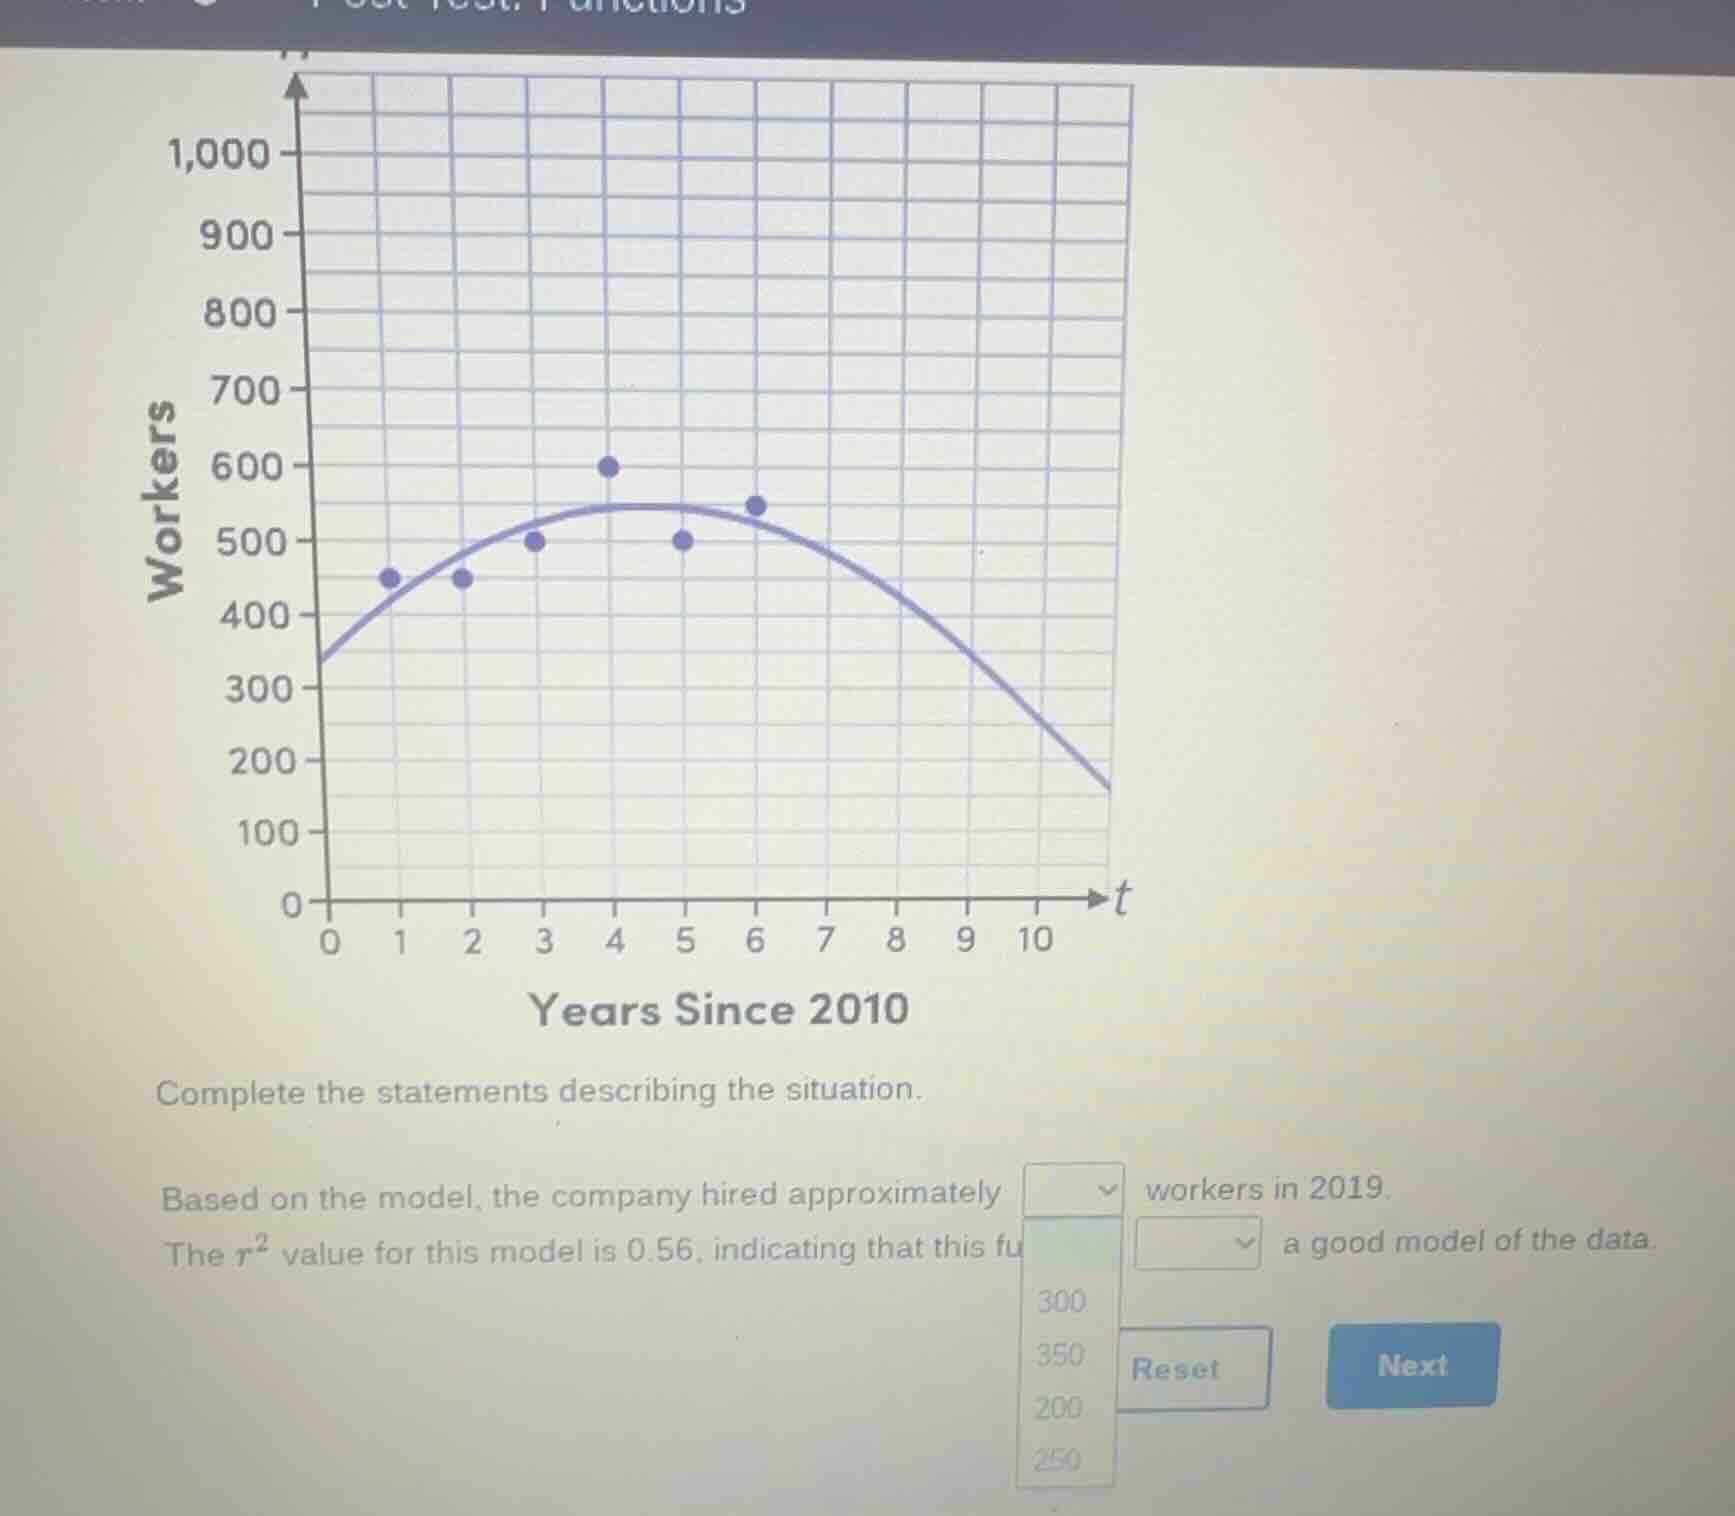
complete the statements describing the situation. based on the model, the company hired approximately dropdown workers in 2019. the ( r^2 ) value for this model is 0.56, indicating that this fu dropdown a good model of the data.
Step1: Determine t for 2019
2019 is 2019 - 2010 = 9 years since 2010, so \( t = 9 \).
Step2: Estimate workers at t=9
From the graph, at \( t = 9 \), the curve is near 300 (checking the y - axis for workers, the value around t = 9 is approximately 300). For the \( r^2 \) value: An \( r^2 \) of 0.56 is not very close to 1, so the model is not a good model (since \( r^2 \) close to 1 means a good fit). But for the number of workers in 2019, based on the graph's model, at t = 9, the approximate number of workers is 300.

Snap & solve any problem in the app
Get step-by-step solutions on Sovi AI
Photo-based solutions with guided steps
Explore more problems and detailed explanations
For the number of workers in 2019: 300. For the model fit: is not (since \( r^2 = 0.56 \) is not close to 1, indicating the model is not a good fit for the data). But focusing on the first blank (number of workers), the answer is 300.