QUESTION IMAGE
Question
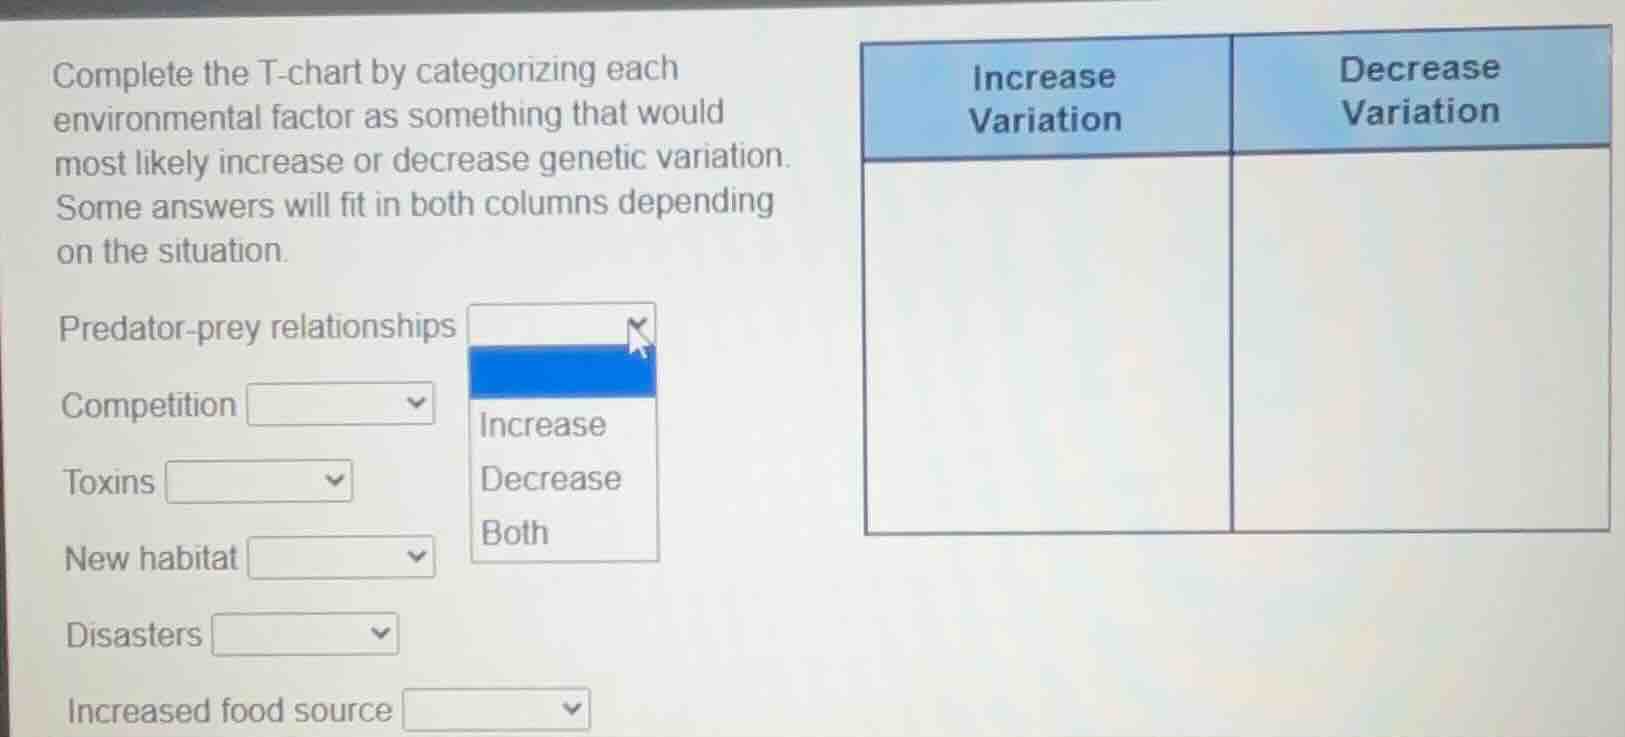
complete the t-chart by categorizing each environmental factor as something that would most likely increase or decrease genetic variation. some answers will fit in both columns depending on the situation. predator-prey relationships competition toxins new habitat disasters increased food source increase variation decrease variation

Snap & solve any problem in the app
Get step-by-step solutions on Sovi AI
Photo-based solutions with guided steps
Explore more problems and detailed explanations
Predator-prey relationships: Both
Competition: Both
Toxins: Decrease
New habitat: Increase
Disasters: Decrease
Increased food source: Increase