QUESTION IMAGE
Question
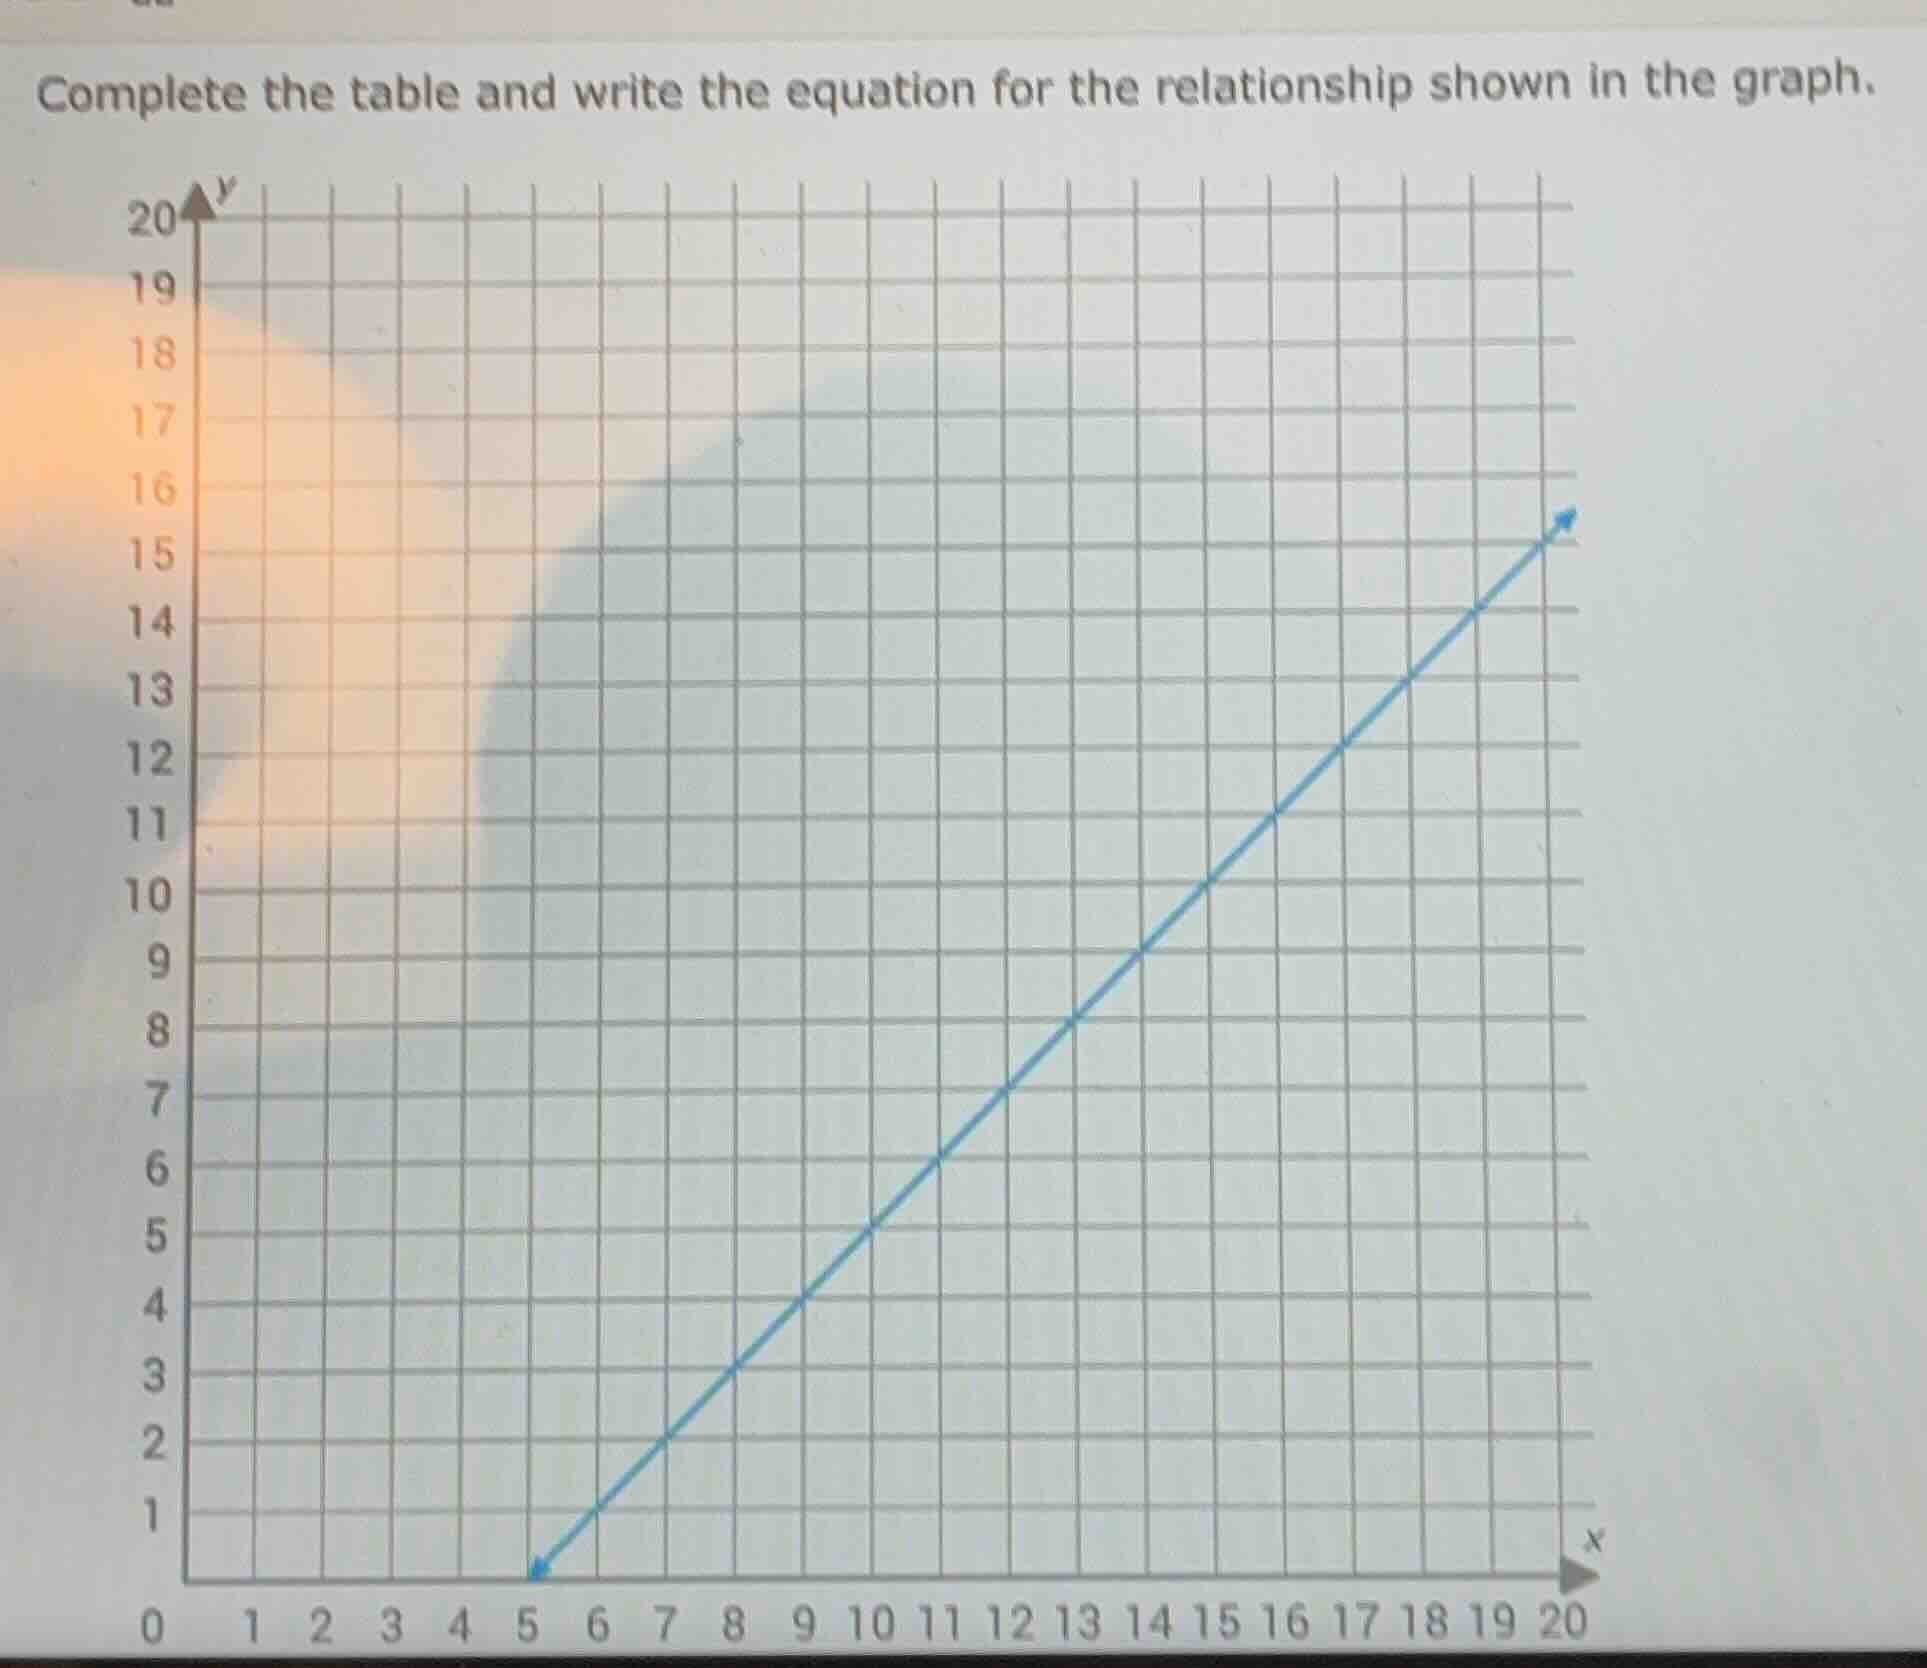
complete the table and write the equation for the relationship shown in the graph.
Step1: Identify intercept points
From the graph, the line passes through $(5,0)$ and $(0,-5)$ (implied, since slope is 1: when $x$ increases by 1, $y$ increases by 1; so when $x=0$, $y=0-5=-5$).
Step2: Calculate slope $m$
Slope formula: $m=\frac{y_2-y_1}{x_2-x_1}$
$m=\frac{2-0}{7-5}=\frac{2}{2}=1$
Step3: Write slope-intercept equation
Slope-intercept form: $y=mx+b$, where $b=-5$
$y=1\cdot x - 5$
Step4: Build the table (sample values)
Choose $x$ values, compute $y$:
- $x=5$: $y=5-5=0$
- $x=7$: $y=7-5=2$
- $x=10$: $y=10-5=5$
- $x=15$: $y=15-5=10$
- $x=19$: $y=19-5=14$

Snap & solve any problem in the app
Get step-by-step solutions on Sovi AI
Photo-based solutions with guided steps
Explore more problems and detailed explanations
Completed Table (sample):
| $x$ | $y$ |
|---|---|
| 7 | 2 |
| 10 | 5 |
| 15 | 10 |
| 19 | 14 |
Equation:
$y = x - 5$