QUESTION IMAGE
Question
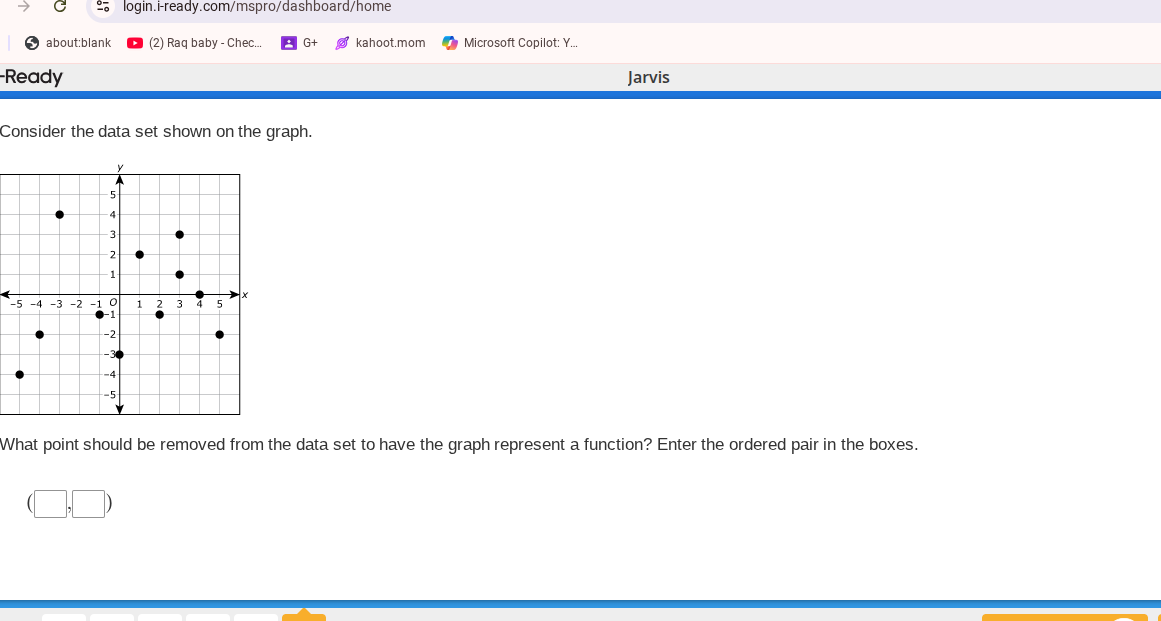
consider the data set shown on the graph.
what point should be removed from the data set to have the graph represent a function? enter the ordered pair in the boxes.
(□,□)
Step1: Recall function definition
A function has exactly one output ($y$-value) for each input ($x$-value).
Step2: Identify duplicate $x$-values
Check each $x$-coordinate:
- $x=-5$: $y=-2, -4$ (duplicate input)
- $x=0$: $y=-1, -3$ (duplicate input)
- All other $x$-values have unique $y$-values.
Step3: Select removable point
Either point from the duplicate $x$-value sets works. For $x=0$, we can remove $(0, -1)$ or $(0, -3)$; for $x=-5$, we can remove $(-5, -2)$ or $(-5, -4)$. A common choice is $(0, -1)$.

Snap & solve any problem in the app
Get step-by-step solutions on Sovi AI
Photo-based solutions with guided steps
Explore more problems and detailed explanations
$(0, -1)$
Note: $(0, -3)$, $(-5, -2)$, or $(-5, -4)$ are also valid correct answers.