QUESTION IMAGE
Question
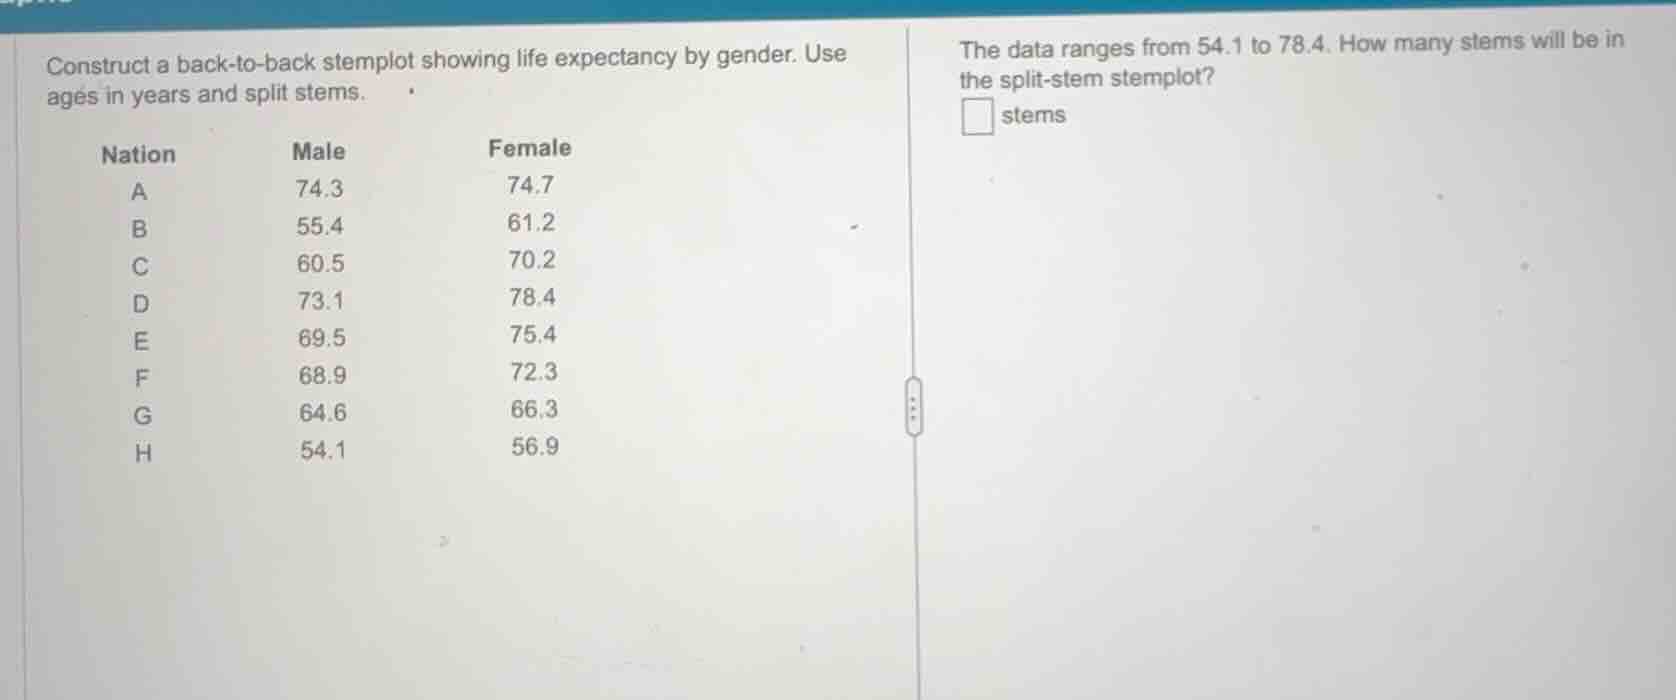
construct a back-to-back stemplot showing life expectancy by gender. use ages in years and split stems.
nation male female
a 74.3 74.7
b 55.4 61.2
c 60.5 70.2
d 73.1 78.4
e 69.5 75.4
f 68.9 72.3
g 64.6 66.3
h 54.1 56.9
the data ranges from 54.1 to 78.4. how many stems will be in the split-stem stemplot?
□ stems
Step1: Define split stem rule
Split each stem into 2: one for leaves 0-4, one for 5-9.
Step2: List whole number stems
Data ranges 54.1 to 78.4, so stems are 54,55,56,57,58,59,60,61,62,63,64,65,66,67,68,69,70,71,72,73,74,75,76,77,78.
Step3: Count total split stems
Each original tens stem (5,6,7) splits: 5 has 5 stems (54,55,56,57,58,59? No, split 50-54 and 55-59 → 2 stems per tens place? Wait no, split stems for 50s: 5 (0-4) and 5 (5-9), but data has 54,55,56. So stems are 5 (0-4), 5 (5-9), 6 (0-4), 6 (5-9), 7 (0-4), 7 (5-9)? No, wait split stems for each 10-unit range into two:
- 50-54: stem 5 (0-4)
- 55-59: stem 5 (5-9)
- 60-64: stem 6 (0-4)
- 65-69: stem 6 (5-9)
- 70-74: stem 7 (0-4)
- 75-79: stem 7 (5-9)
Now check data coverage: 54.1 (fits 5(0-4)), 55.4,56.9 (fit 5(5-9)), 60.5,61.2,64.6 (fit 6(0-4)), 66.3,68.9,69.5 (fit 6(5-9)),70.2,72.3,73.1,74.3,74.7 (fit7(0-4)),75.4,78.4 (fit7(5-9)). Total stems: 6.

Snap & solve any problem in the app
Get step-by-step solutions on Sovi AI
Photo-based solutions with guided steps
Explore more problems and detailed explanations
6