QUESTION IMAGE
Question
on core algebra i b-cr
eng
quiz complete
time rem:
50:
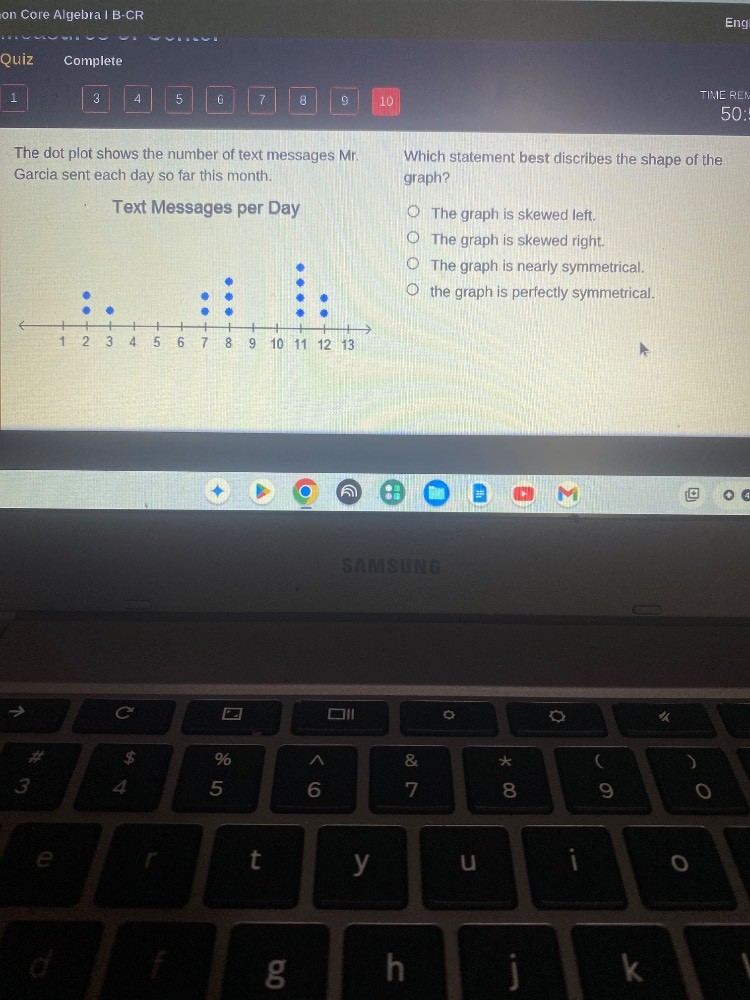
the dot plot shows the number of text messages mr. garcia sent each day so far this month.
text messages per day
which statement best discribes the shape of the graph?
○ the graph is skewed left.
○ the graph is skewed right.
○ the graph is nearly symmetrical.
○ the graph is perfectly symmetrical.
Skewed left means most data clusters on the right, with a tail to the left. Here, the dot plot has more dots on the higher values (right side) and fewer on the lower values (left side), creating a leftward tail. Symmetrical would mean even distribution on both sides of a center, which this does not have.

Snap & solve any problem in the app
Get step-by-step solutions on Sovi AI
Photo-based solutions with guided steps
Explore more problems and detailed explanations
The graph is skewed left.