QUESTION IMAGE
Question
on core algebra i b-cr
pre-test complete
1 2 3 4
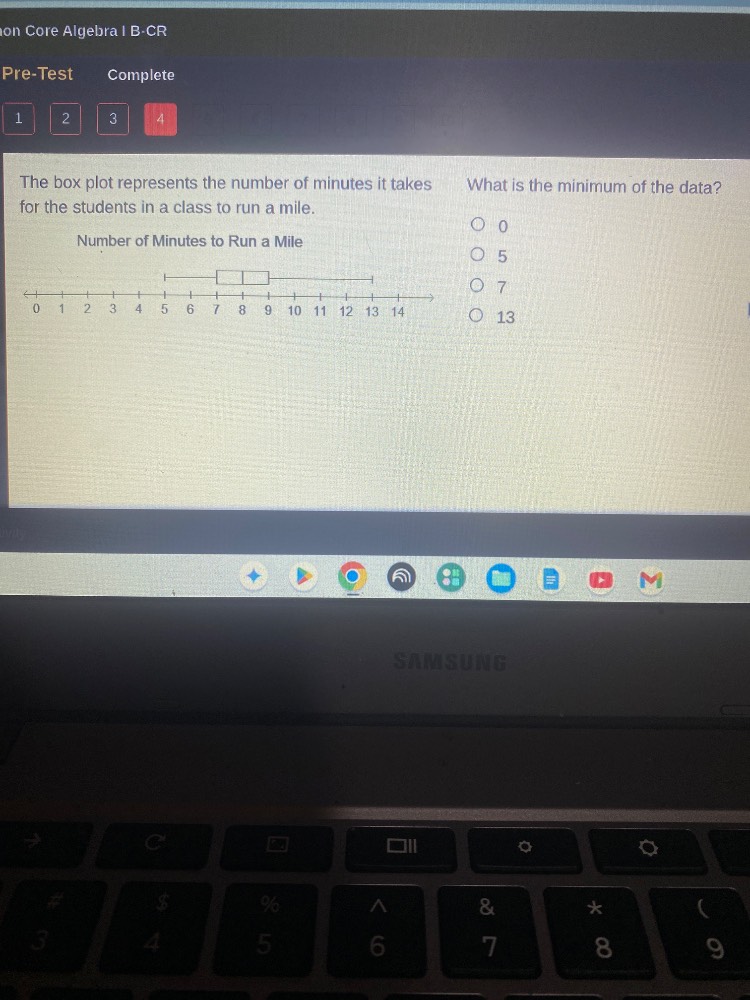
the box plot represents the number of minutes it takes for the students in a class to run a mile.
number of minutes to run a mile
what is the minimum of the data?
○ 0
○ 5
○ 7
○ 13
Step1: Identify box plot minimum
In a box plot, the leftmost whisker endpoint marks the minimum value of the dataset. Looking at the plot, this endpoint aligns with 5 on the number line.

Snap & solve any problem in the app
Get step-by-step solutions on Sovi AI
Photo-based solutions with guided steps
Explore more problems and detailed explanations
B. 5