QUESTION IMAGE
Question
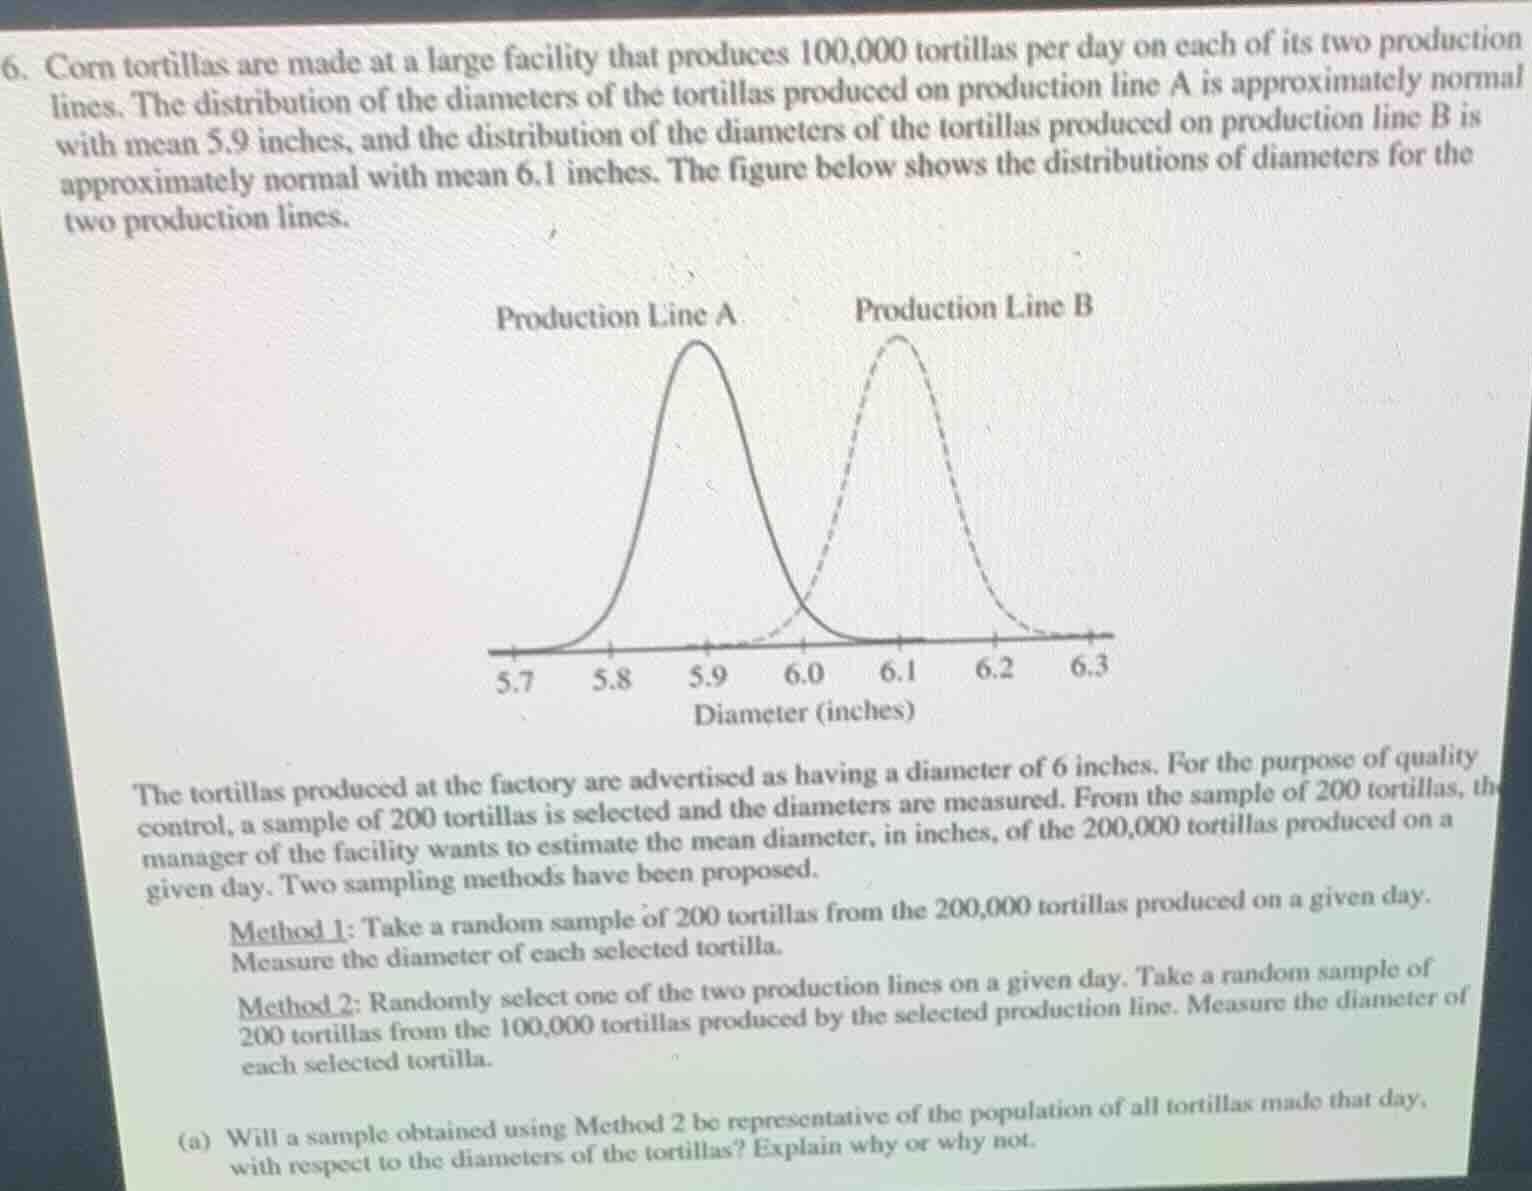
- corn tortillas are made at a large facility that produces 100,000 tortillas per day on each of its two production lines. the distribution of the diameters of the tortillas produced on production line a is approximately normal with mean 5.9 inches, and the distribution of the diameters of the tortillas produced on production line b is approximately normal with mean 6.1 inches. the figure below shows the distributions of diameters for the two production lines.
figure: two normal distribution curves labeled production line a (solid line) and production line b (dashed line) with x - axis labeled diameter (inches) from 5.7 to 6.3. production line a peaks at 5.9, production line b peaks at 6.1
the tortillas produced at the factory are advertised as having a diameter of 6 inches. for the purpose of quality control, a sample of 200 tortillas is selected and the diameters are measured. from the sample of 200 tortillas, the manager of the facility wants to estimate the mean diameter, in inches, of the 200,000 tortillas produced on a given day. two sampling methods have been proposed.
method 1: take a random sample of 200 tortillas from the 200,000 tortillas produced on a given day. measure the diameter of each selected tortilla.
method 2: randomly select one of the two production lines on a given day. take a random sample of 200 tortillas from the 100,000 tortillas produced by the selected production line. measure the diameter of each selected tortilla.
(a) will a sample obtained using method 2 be representative of the population of all tortillas made that day, with respect to the diameters of the tortillas? explain why or why not.
To determine if Method 2's sample is representative, we analyze the population and sampling. The population includes tortillas from both lines (A: mean 5.9, B: mean 6.1). Method 2 samples only one line. Since the two lines have different mean diameters, a sample from just one line can't reflect the combined population's diameter distribution. For example, if Line A is chosen, the sample mean will be around 5.9, not representing the overall mean (between 5.9 and 6.1). If Line B is chosen, it's around 6.1. Thus, it fails to include both lines' variation, so it's not representative.

Snap & solve any problem in the app
Get step-by-step solutions on Sovi AI
Photo-based solutions with guided steps
Explore more problems and detailed explanations
A sample obtained using Method 2 will not be representative of the population of all tortillas made that day with respect to the diameters of the tortillas. This is because the population consists of tortillas from two production lines (A and B) with different mean diameters (5.9 inches for Line A and 6.1 inches for Line B). Method 2 only samples from one of the two production lines. As a result, the sample will only reflect the diameter distribution of a single production line, not the combined distribution of both lines that make up the entire population of 200,000 tortillas. For the sample to be representative, it should account for the variation and differences (in this case, the different mean diameters) from both production lines, which Method 2 does not do.