QUESTION IMAGE
Question
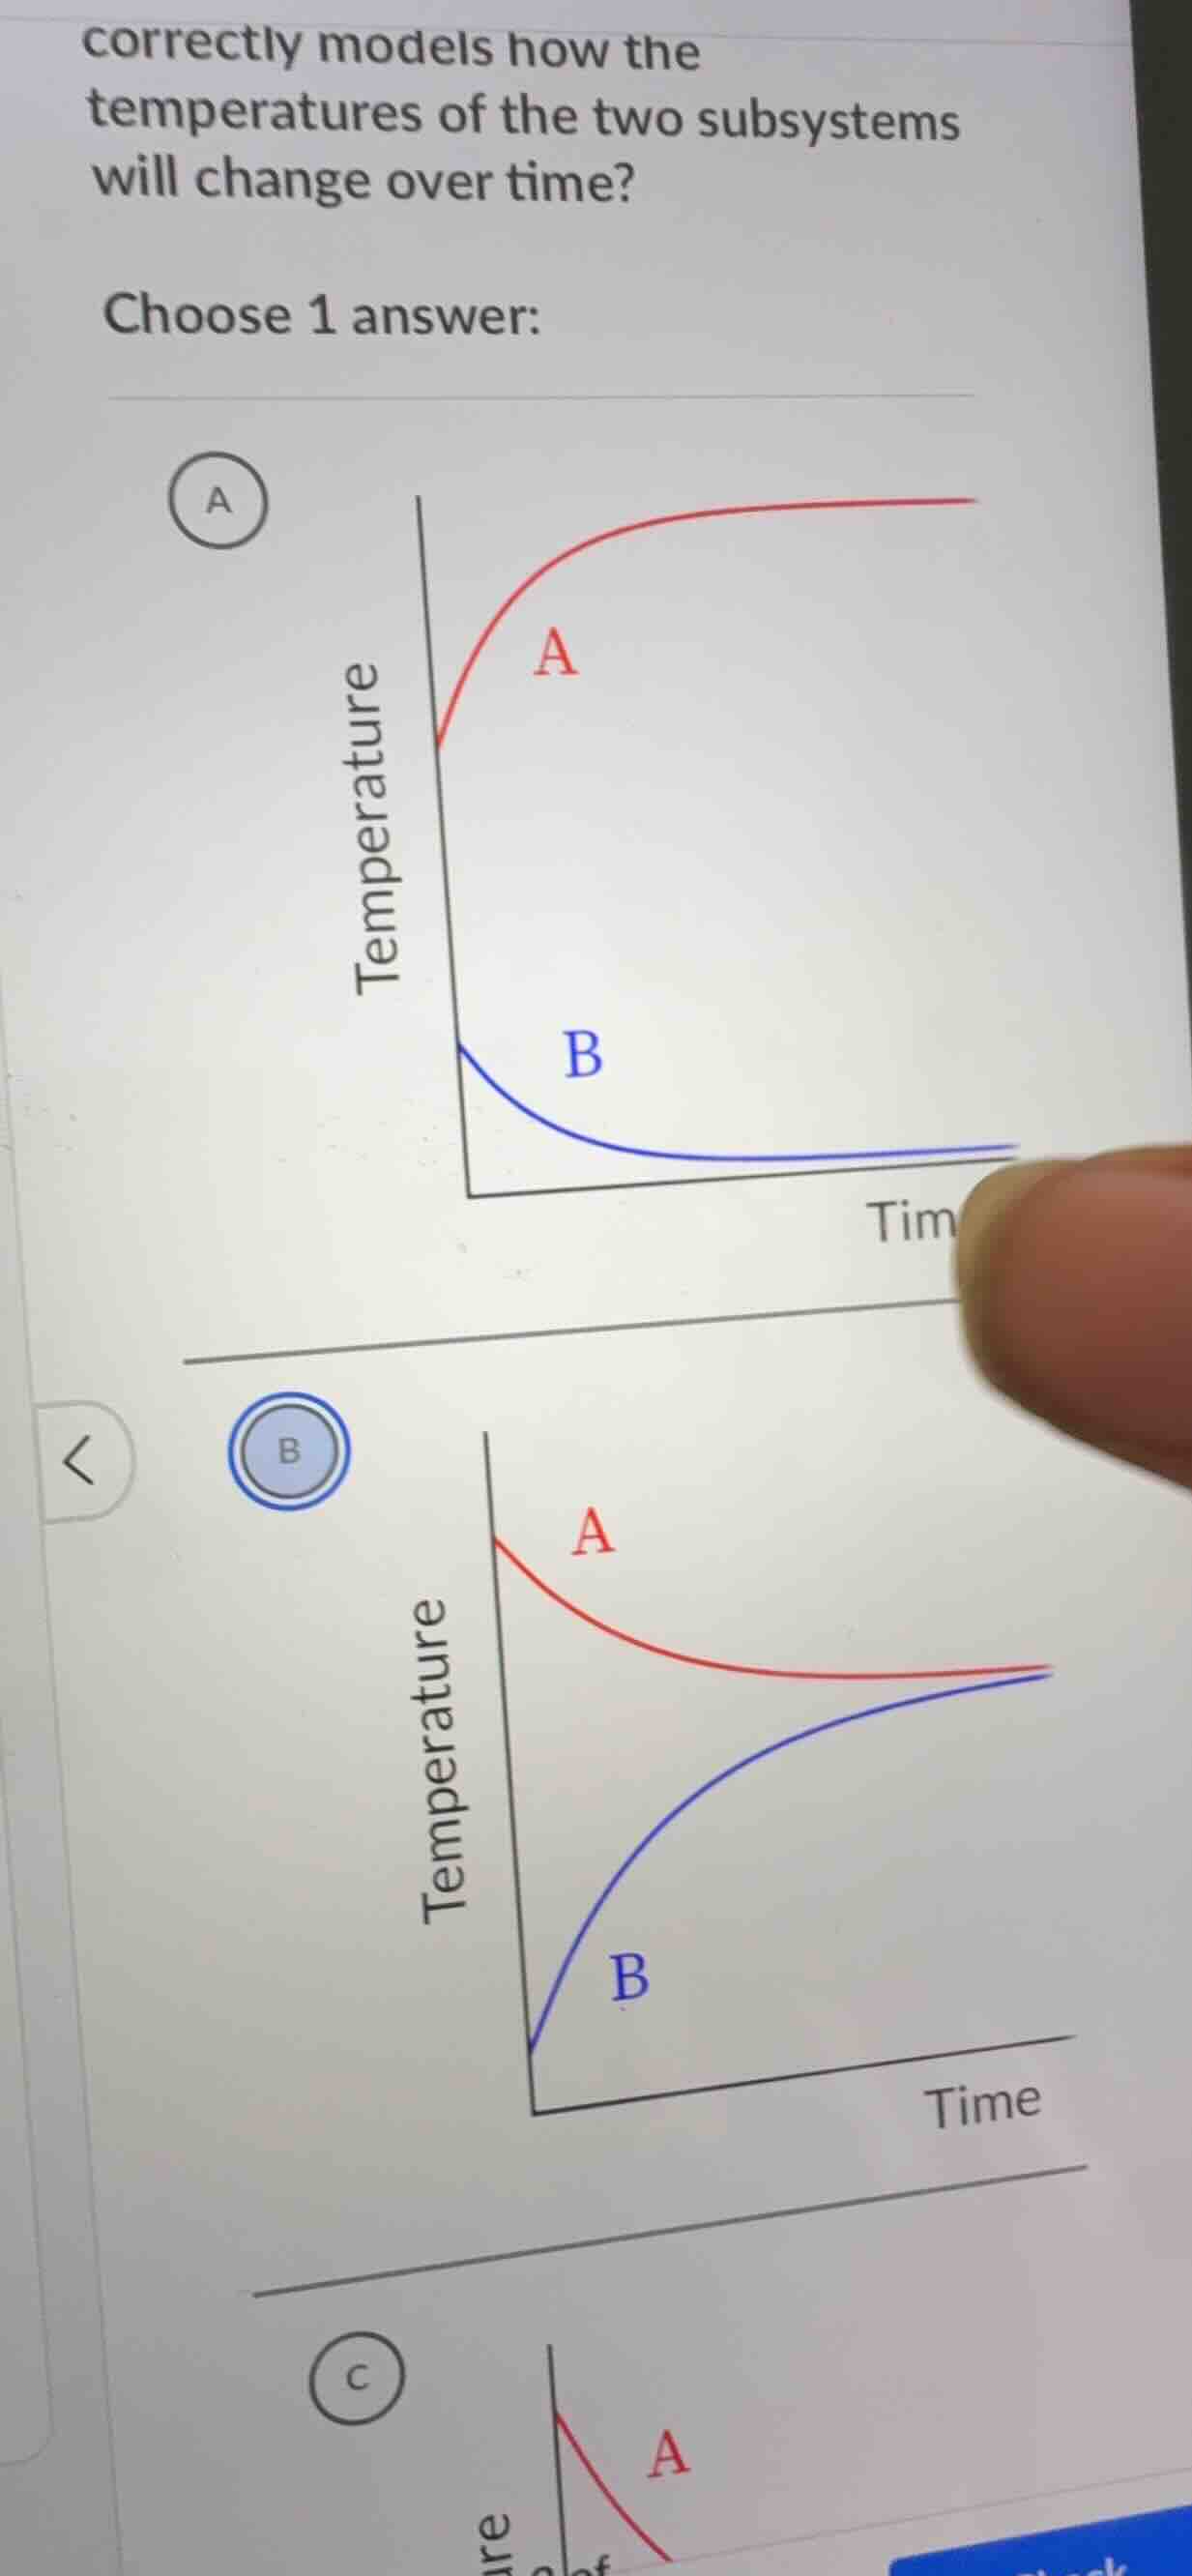
correctly models how the temperatures of the two subsystems will change over time? choose 1 answer:

Snap & solve any problem in the app
Get step-by-step solutions on Sovi AI
Photo-based solutions with guided steps
Explore more problems and detailed explanations
B. A graph where curve A (red) decreases in temperature over time approaching a stable value, and curve B (blue) increases in temperature over time approaching the same stable value as curve A