QUESTION IMAGE
Question
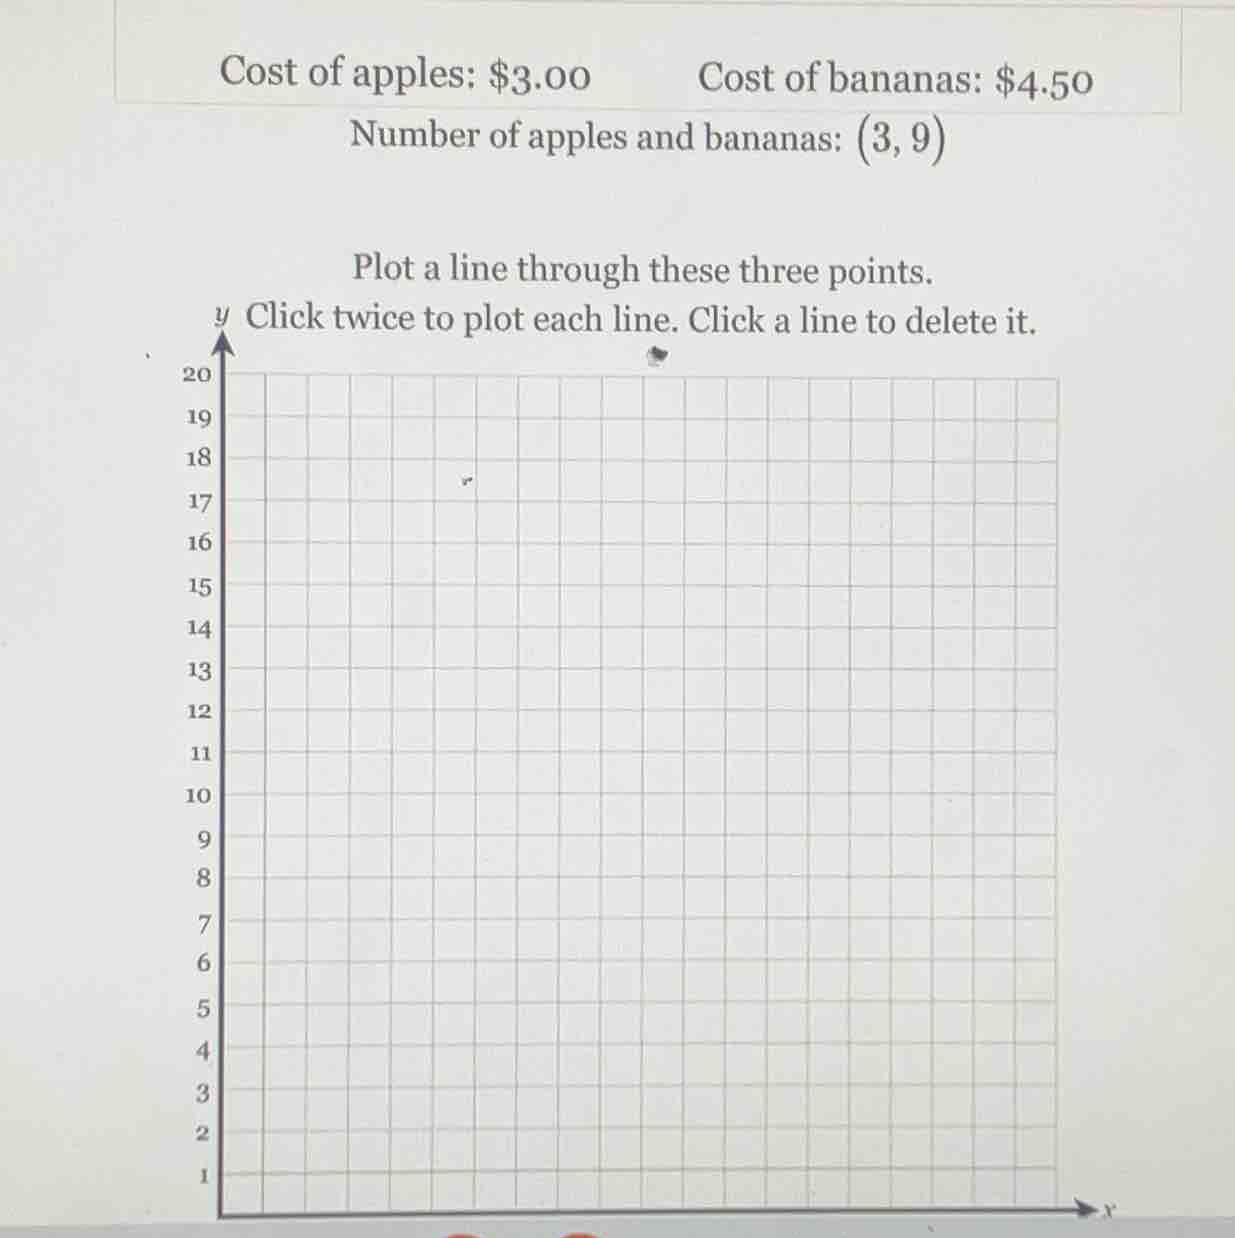
cost of apples: $3.00 cost of bananas: $4.50
number of apples and bananas: (3, 9)
plot a line through these three points.
y click twice to plot each line. click a line to delete it.
20
19
18
17
16
15
14
13
12
11
10
9
8
7
6
5
4
3
2
1
x
To solve the problem of plotting the line, we first need to understand the context. Let's assume the \(x\)-axis represents the number of apples and the \(y\)-axis represents the number of bananas (or vice - versa, or maybe total cost, but from the given point \((3,9)\) and costs, we can find other points).
Step 1: Find the equation of the line (assuming it's a linear relationship related to cost)
Let's assume the cost function. Let \(x\) be the number of apples and \(y\) be the number of bananas. The cost of apples is \(\$3\) per apple and bananas is \(\$4.5\) per banana. Let the total cost \(C\) be a constant (if we are dealing with a fixed budget). Then \(3x + 4.5y=C\). We know that when \(x = 3\) and \(y=9\), \(C=3\times3 + 4.5\times9=9 + 40.5=\$49.5\).
We can find two other points:
- If \(x = 0\), then \(4.5y=49.5\), so \(y=\frac{49.5}{4.5} = 11\). So the point is \((0,11)\).
- If \(y = 0\), then \(3x=49.5\), so \(x=\frac{49.5}{3}=16.5\). So the point is \((16.5,0)\).
Step 2: Plot the points
We already have the point \((3,9)\), and we found \((0,11)\) and \((16.5,0)\). To plot the line, we can use these three points.
- First, plot the point \((0,11)\) on the \(y\)-axis (since \(x = 0\) and \(y = 11\)).
- Then plot the point \((3,9)\) (where \(x = 3\) and \(y=9\)).
- Then plot the point \((16.5,0)\) on the \(x\)-axis (where \(x = 16.5\) and \(y = 0\)).
- After plotting these three points, we can draw a straight line passing through them by clicking twice on each pair of points (first on one point, then on another) to create the line segments that connect them, and the overall line will be formed.
If we consider the simple case of plotting the line through \((0,11)\), \((3,9)\) and \((16.5,0)\):
- For the point \((0,11)\): Locate \(x = 0\) (the \(y\)-axis) and \(y = 11\) on the grid and mark it.
- For the point \((3,9)\): Locate \(x = 3\) and \(y = 9\) on the grid and mark it.
- For the point \((16.5,0)\): Locate \(x=16.5\) (half - way between \(x = 16\) and \(x = 17\)) and \(y = 0\) (the \(x\)-axis) and mark it.
Then, to draw the line, click on \((0,11)\) and then on \((3,9)\) to draw a segment, then click on \((3,9)\) and then on \((16.5,0)\) to complete the line (or click on \((0,11)\) and then on \((16.5,0)\) directly as well, since three non - collinear points (but in this case, they are collinear) can be used to define a line).
Since the problem is about plotting, the key is to identify the correct points (either from the cost - based calculation or from the given relationship) and then use the plotting tool to connect them.
If we assume a simpler case where we just need to plot the line through \((0,11)\), \((3,9)\) and \((16.5,0)\):
- First, find the coordinates on the grid. The \(x\)-axis and \(y\)-axis are labeled, with the \(y\)-axis going from 1 to 20 and \(x\)-axis (we can assume) from 0 onwards.
- Mark \((0,11)\): On the \(y\)-axis, at \(y = 11\) (since \(x = 0\)).
- Mark \((3,9)\): Move 3 units along the \(x\)-axis and 9 units along the \(y\)-axis.
- Mark \((16.5,0)\): Move 16.5 units along the \(x\)-axis (between \(x = 16\) and \(x = 17\)) and 0 units along the \(y\)-axis.
- Then, use the plotting tool to draw a line connecting these three points by clicking on two points at a time (e.g., click on \((0,11)\) and then on \((3,9)\), then click on \((3,9)\) and then on \((16.5,0)\)).
The final action is to plot the line through the points \((0,11)\), \((3,9)\) and \((16.5,0)\) (or other relevant points based on the correct interpretation of the problem) using the given plotting interface.

Snap & solve any problem in the app
Get step-by-step solutions on Sovi AI
Photo-based solutions with guided steps
Explore more problems and detailed explanations
To solve the problem of plotting the line, we first need to understand the context. Let's assume the \(x\)-axis represents the number of apples and the \(y\)-axis represents the number of bananas (or vice - versa, or maybe total cost, but from the given point \((3,9)\) and costs, we can find other points).
Step 1: Find the equation of the line (assuming it's a linear relationship related to cost)
Let's assume the cost function. Let \(x\) be the number of apples and \(y\) be the number of bananas. The cost of apples is \(\$3\) per apple and bananas is \(\$4.5\) per banana. Let the total cost \(C\) be a constant (if we are dealing with a fixed budget). Then \(3x + 4.5y=C\). We know that when \(x = 3\) and \(y=9\), \(C=3\times3 + 4.5\times9=9 + 40.5=\$49.5\).
We can find two other points:
- If \(x = 0\), then \(4.5y=49.5\), so \(y=\frac{49.5}{4.5} = 11\). So the point is \((0,11)\).
- If \(y = 0\), then \(3x=49.5\), so \(x=\frac{49.5}{3}=16.5\). So the point is \((16.5,0)\).
Step 2: Plot the points
We already have the point \((3,9)\), and we found \((0,11)\) and \((16.5,0)\). To plot the line, we can use these three points.
- First, plot the point \((0,11)\) on the \(y\)-axis (since \(x = 0\) and \(y = 11\)).
- Then plot the point \((3,9)\) (where \(x = 3\) and \(y=9\)).
- Then plot the point \((16.5,0)\) on the \(x\)-axis (where \(x = 16.5\) and \(y = 0\)).
- After plotting these three points, we can draw a straight line passing through them by clicking twice on each pair of points (first on one point, then on another) to create the line segments that connect them, and the overall line will be formed.
If we consider the simple case of plotting the line through \((0,11)\), \((3,9)\) and \((16.5,0)\):
- For the point \((0,11)\): Locate \(x = 0\) (the \(y\)-axis) and \(y = 11\) on the grid and mark it.
- For the point \((3,9)\): Locate \(x = 3\) and \(y = 9\) on the grid and mark it.
- For the point \((16.5,0)\): Locate \(x=16.5\) (half - way between \(x = 16\) and \(x = 17\)) and \(y = 0\) (the \(x\)-axis) and mark it.
Then, to draw the line, click on \((0,11)\) and then on \((3,9)\) to draw a segment, then click on \((3,9)\) and then on \((16.5,0)\) to complete the line (or click on \((0,11)\) and then on \((16.5,0)\) directly as well, since three non - collinear points (but in this case, they are collinear) can be used to define a line).
Since the problem is about plotting, the key is to identify the correct points (either from the cost - based calculation or from the given relationship) and then use the plotting tool to connect them.
If we assume a simpler case where we just need to plot the line through \((0,11)\), \((3,9)\) and \((16.5,0)\):
- First, find the coordinates on the grid. The \(x\)-axis and \(y\)-axis are labeled, with the \(y\)-axis going from 1 to 20 and \(x\)-axis (we can assume) from 0 onwards.
- Mark \((0,11)\): On the \(y\)-axis, at \(y = 11\) (since \(x = 0\)).
- Mark \((3,9)\): Move 3 units along the \(x\)-axis and 9 units along the \(y\)-axis.
- Mark \((16.5,0)\): Move 16.5 units along the \(x\)-axis (between \(x = 16\) and \(x = 17\)) and 0 units along the \(y\)-axis.
- Then, use the plotting tool to draw a line connecting these three points by clicking on two points at a time (e.g., click on \((0,11)\) and then on \((3,9)\), then click on \((3,9)\) and then on \((16.5,0)\)).
The final action is to plot the line through the points \((0,11)\), \((3,9)\) and \((16.5,0)\) (or other relevant points based on the correct interpretation of the problem) using the given plotting interface.