QUESTION IMAGE
Question
cphs : advanced algebra: concepts and connections - block (27.0831030)
properties of probability distributions
classifying data distributions
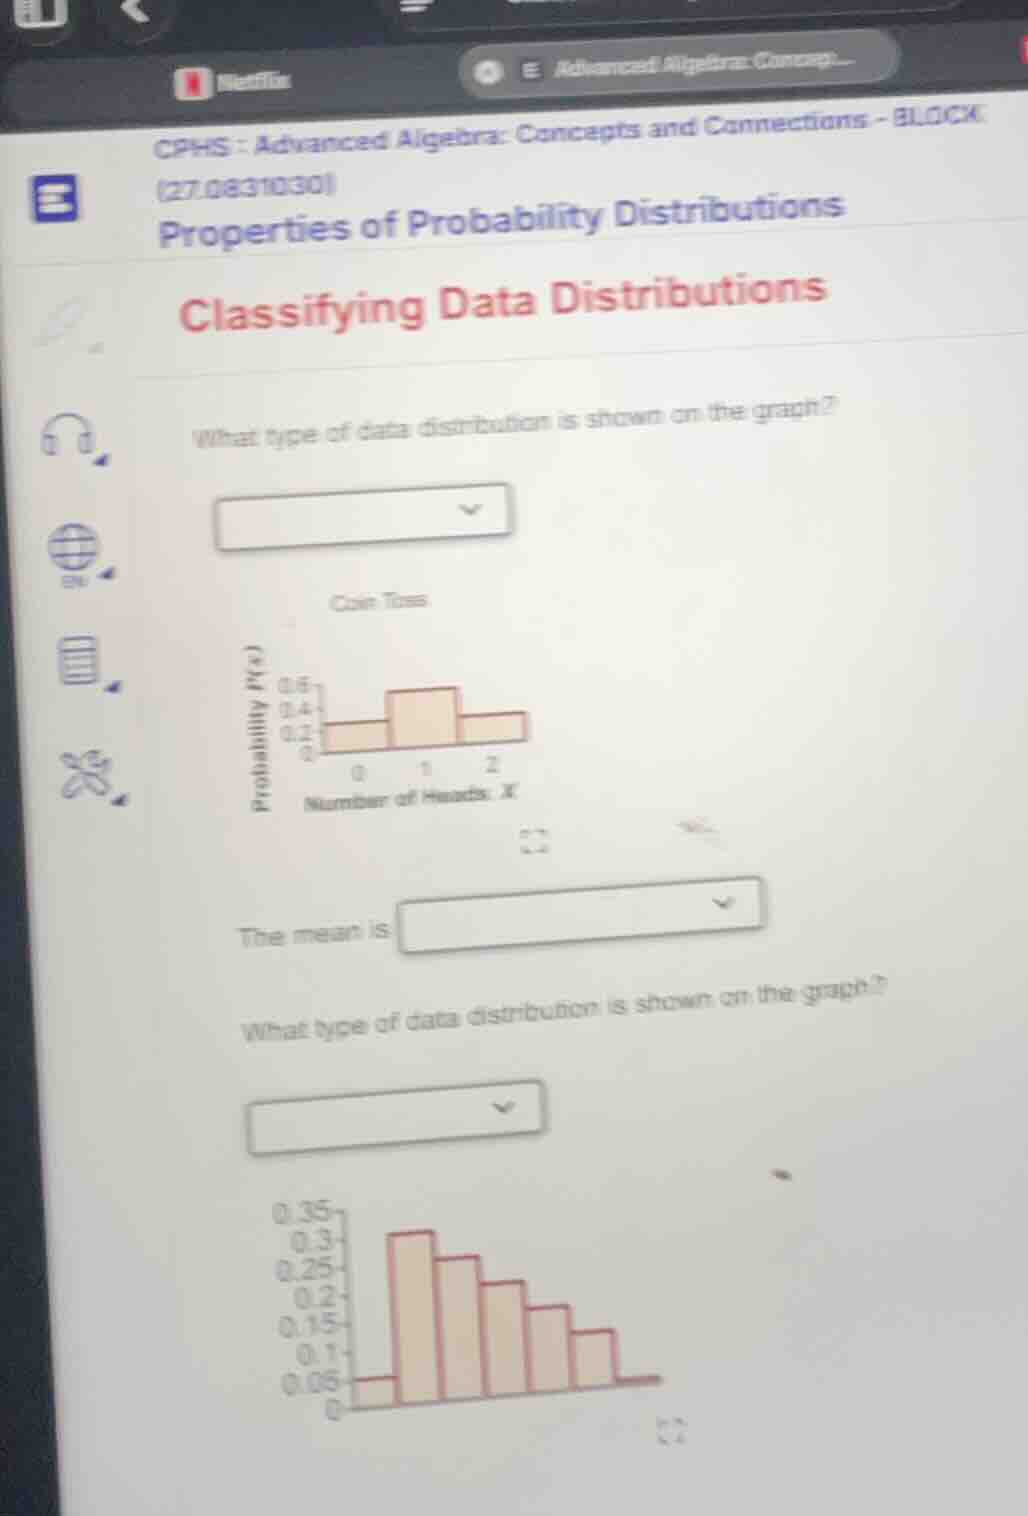
what type of data distribution is shown on the graph?
dropdown
coin toss
probability p(x)
0.6
0.4
0.2
0
0 1 2
number of heads: x
the mean is dropdown
what type of data distribution is shown on the graph?
dropdown
0.35
0.3
0.25
0.2
0.15
0.1
0.05
0
First Part: Coin Toss Distribution
Step1: Analyze the distribution shape
The coin toss distribution (number of heads: 0, 1, 2) has probabilities that are symmetric around the middle value (1). For a fair coin toss (assuming two coins, since number of heads can be 0,1,2), the probabilities for 0 and 2 heads are equal, and the probability for 1 head is the highest. This is a symmetric distribution, specifically a binomial distribution (for coin tosses, which is a discrete probability distribution) that is symmetric (unimodal with the peak in the middle and tails equal on both sides).
Step2: Determine the type
A symmetric distribution has data values symmetrically distributed around the mean. In this case, the distribution of number of heads in coin tosses (with two coins, for example) is symmetric because \( P(X = 0)=P(X = 2) \) and \( P(X = 1) \) is the maximum, so it's a symmetric (or normal - like for discrete, but more accurately symmetric binomial) distribution. Also, since it's a discrete distribution with a single peak (unimodal) and symmetric, it can be classified as a symmetric (or unimodal symmetric) distribution. For the mean, in a symmetric distribution, the mean is at the center (around the peak). For a binomial distribution \( X\sim B(n,p) \), the mean is \( np \). If we assume two coins (\( n = 2 \)) and \( p=0.5 \), the mean is \( 2\times0.5 = 1 \), which is the center of the distribution (between 0,1,2).
(for the second distribution):
Step1: Analyze the shape
The distribution has a single peak (unimodal) with the peak on the left - hand side of the graph. As we move from left to right (increasing values of the variable on the x - axis), the height of the bars (probabilities) decreases, but there are still bars (non - zero probabilities) for higher values of the variable. This means that the right - hand tail (the part of the distribution with higher values) is longer than the left - hand tail (the part with lower values).
Step2: Determine the type
A distribution with a longer right tail is called a right - skewed (or positively skewed) distribution. In a right - skewed distribution, the mean is greater than the median, and the mode is less than the median (since the mode is at the peak, which is on the left).

Snap & solve any problem in the app
Get step-by-step solutions on Sovi AI
Photo-based solutions with guided steps
Explore more problems and detailed explanations
(for the first distribution - Coin Toss):
The type of data distribution is a symmetric (unimodal symmetric) distribution (or more specifically, a symmetric binomial distribution). The mean is equal to the median and mode (for symmetric distributions), and for the coin toss (two coins) example, the mean is \( 1 \) (if \( n = 2,p = 0.5 \), mean \(=\mu=np = 2\times0.5=1\)).
Second Part: The Second Distribution (Right - Skewed? Wait, No - Wait the second graph)
Wait, the second graph: the bars start low, peak, then decrease but the right tail is longer? Wait no, looking at the y - axis (probability) and x - axis (let's assume a variable). The first bar (leftmost) is small, then the bar increases to a peak, then decreases, but the right tail (towards higher x - values) has bars that are non - zero but get smaller. Wait, no - actually, if the left tail is shorter and the right tail is longer, it's right - skewed? Wait no, wait the direction of skewness: a right - skewed (positively skewed) distribution has a longer right tail (higher x - values have more spread out data), and a left - skewed (negatively skewed) has a longer left tail. But in the second graph, the leftmost bar is small, then the bar height increases to a peak, then decreases, and the right side (higher x) has bars that are still present but decreasing. Wait, actually, if the distribution has a peak and then the values decrease as we move to the right, but the left tail (lower x) is short (only a small bar at the leftmost) and the right tail is long (bars extending to the right), it's a right - skewed? No, wait no: skewness is determined by the tail. If the tail is on the right (higher values), it's right - skewed (positively skewed). But wait, in the graph, the leftmost bar is small, then the bar goes up, then down, and the right side has bars that are getting smaller but are still there. Wait, actually, maybe it's a left - skewed? No, no. Let's recall: in a left - skewed distribution, the mean is less than the median, and the left tail is long. In a right - skewed, mean is greater than median, right tail is long.
Wait, the second graph: the first bar (x = 0 or the first category) has a small probability (0.05), then the next bar is the highest (around 0.3), then the bars decrease as x increases. So the left tail (x = 0) is short, and the right tail (higher x) is long (because there are bars for higher x - values, even if their probability is low). So this is a right - skewed (positively skewed) distribution? Wait no, wait: if the peak is on the left side of the distribution and the tail is on the right, it's right - skewed. Wait, no: the peak is the highest bar. If the highest bar is on the left, and then the bars decrease as we move to the right, the right tail is longer (because the bars go on to the right with non - zero probability), so it's a right - skewed (positively skewed) distribution.