QUESTION IMAGE
Question
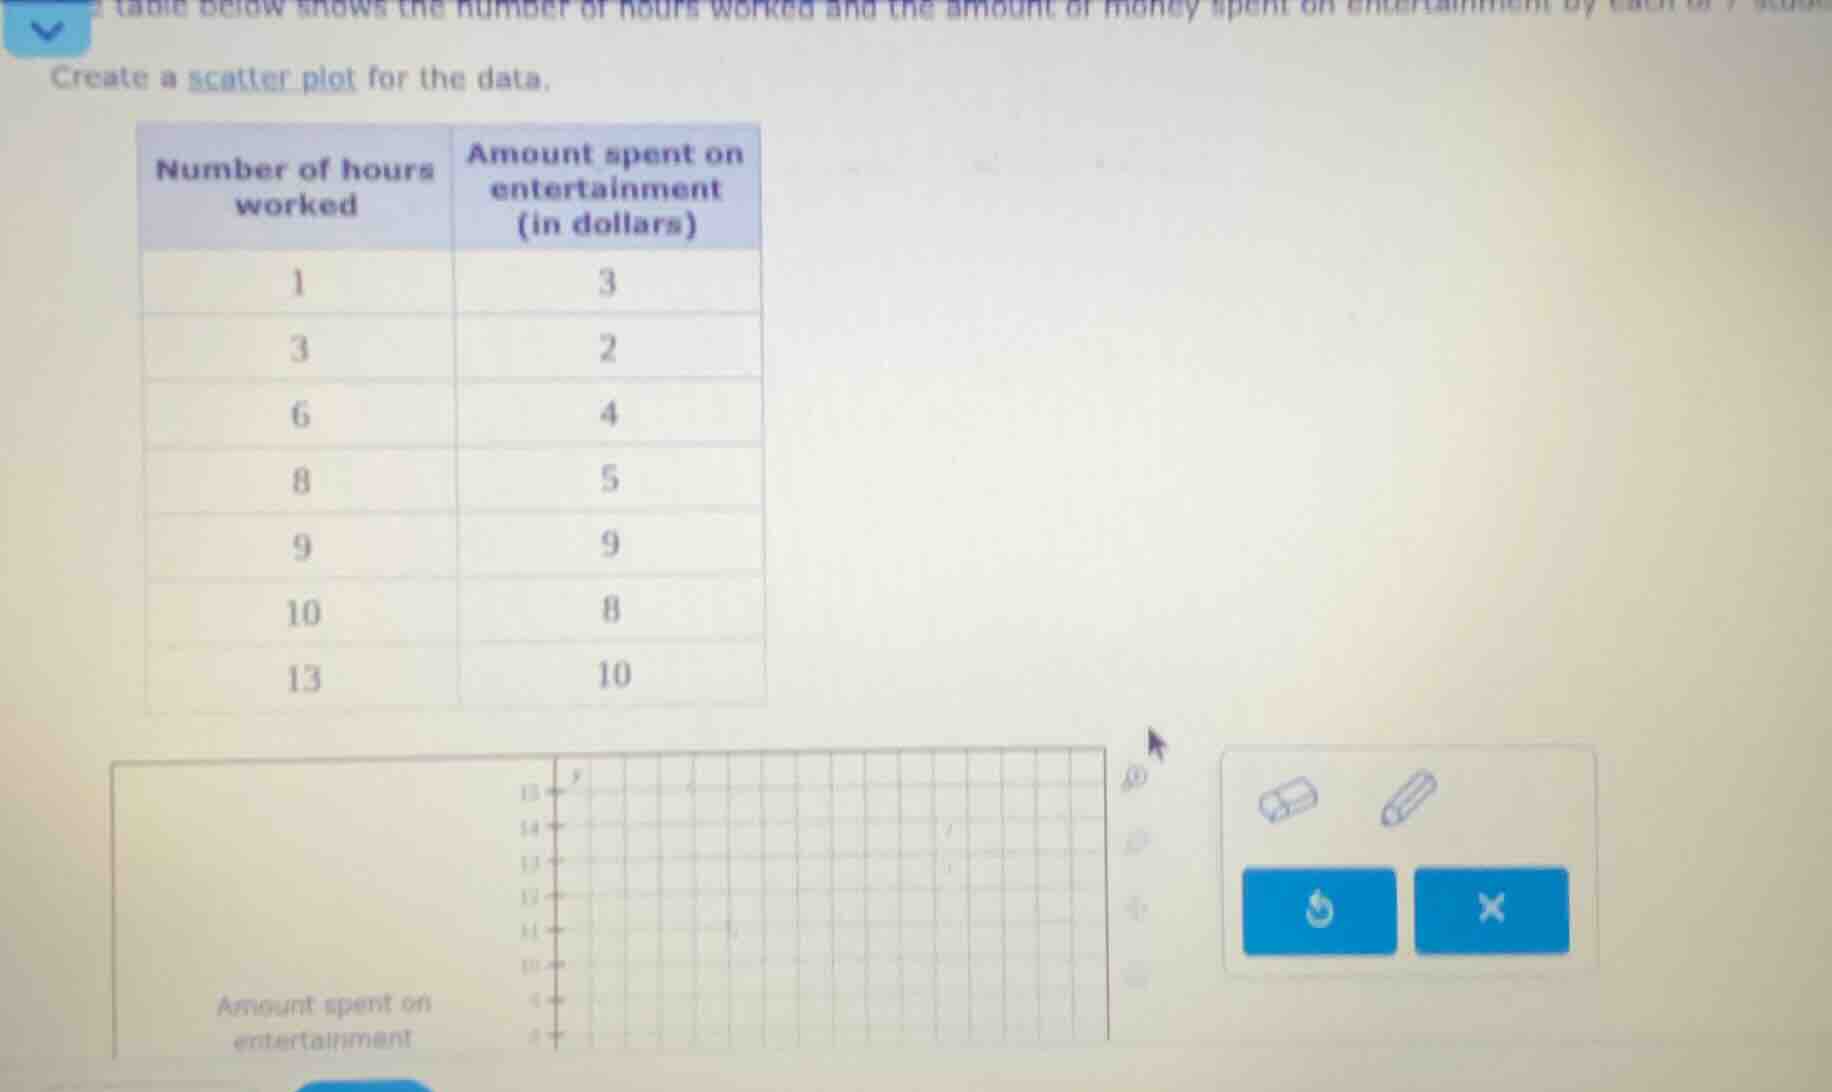
create a scatter plot for the data.
number of hours worked | amount spent on entertainment (in dollars)
1 | 3
3 | 2
6 | 4
8 | 5
9 | 9
10 | 8
13 | 10
Step1: Identify data pairs
Pairs: $(1,3), (3,2), (6,4), (8,5), (9,9), (10,8), (13,10)$
Step2: Assign axes
x-axis: Hours worked; y-axis: Entertainment cost
Step3: Plot each data point
Mark each pair on the grid:
- $(1,3)$: x=1, y=3
- $(3,2)$: x=3, y=2
- $(6,4)$: x=6, y=4
- $(8,5)$: x=8, y=5
- $(9,9)$: x=9, y=9
- $(10,8)$: x=10, y=8
- $(13,10)$: x=13, y=10

Snap & solve any problem in the app
Get step-by-step solutions on Sovi AI
Photo-based solutions with guided steps
Explore more problems and detailed explanations
A scatter plot with the following points plotted:
- (1, 3), (3, 2), (6, 4), (8, 5), (9, 9), (10, 8), (13, 10)
(With the horizontal axis labeled "Number of hours worked" and vertical axis labeled "Amount spent on entertainment (in dollars)")