QUESTION IMAGE
Question
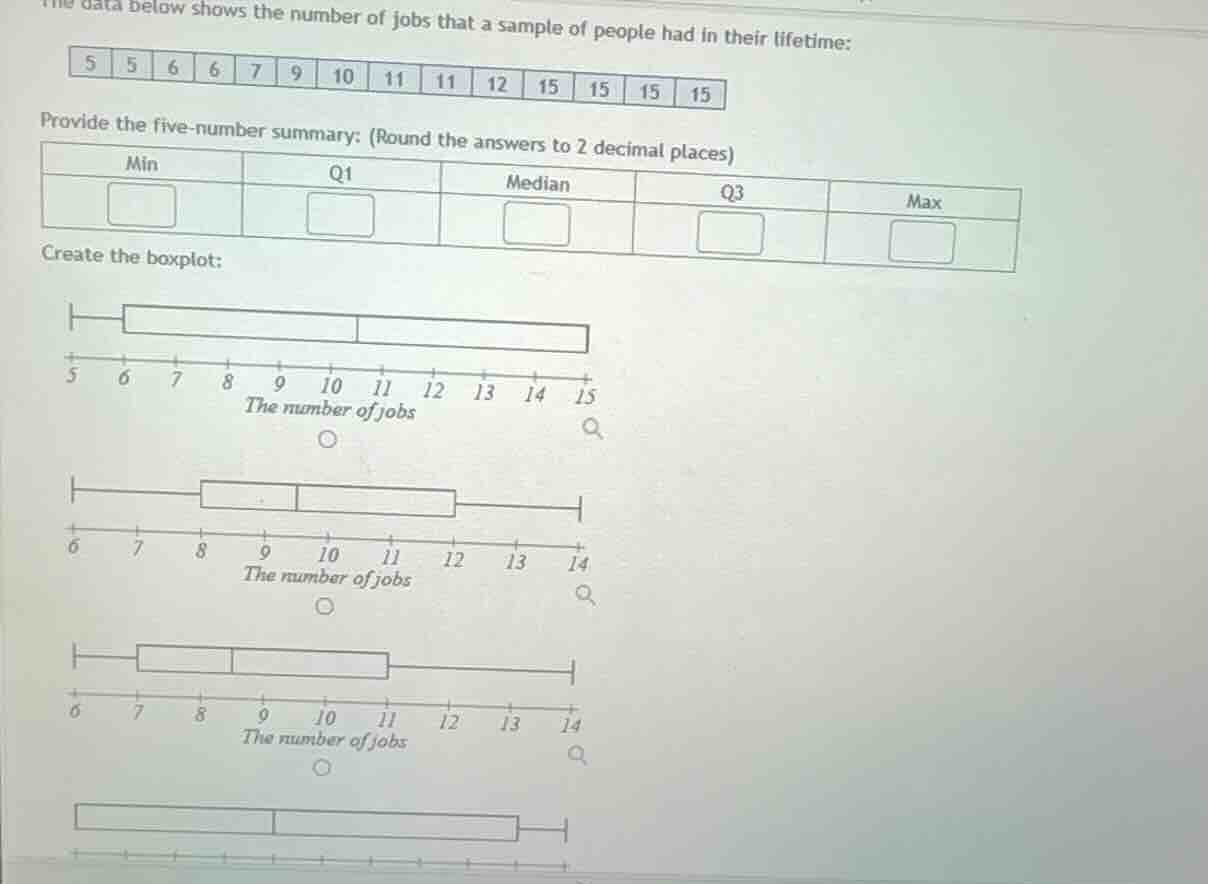
the data below shows the number of jobs that a sample of people had in their lifetime:
5 5 6 6 7 9 10 11 11 12 15 15 15 15
provide the five-number summary: (round the answers to 2 decimal places)
min q1 median q3 max
create the boxplot:
Step1: Identify Min and Max
Min is the smallest value, Max is largest.
Min = 5, Max = 15
Step2: Find the Median
Data is sorted: $[5,5,6,6,7,9,10,11,11,12,15,15,15,15,15]$. There are $n=15$ values. Median is the $\frac{n+1}{2}=8$th value.
Median = 11.00
Step3: Calculate Q1 (Lower Quartile)
Q1 is median of first half (first 7 values: $[5,5,6,6,7,9,10]$). It is the 4th value.
Q1 = 6.00
Step4: Calculate Q3 (Upper Quartile)
Q3 is median of second half (last 7 values: $[11,12,15,15,15,15,15]$). It is the 4th value of this subset.
Q3 = 15.00
Step5: Match to Boxplot
The boxplot must have whiskers at 5 and 15, box edges at 6 and 15, median line at 11. This matches the first boxplot (axis 5-15, box from 6 to 15, median at 11).

Snap & solve any problem in the app
Get step-by-step solutions on Sovi AI
Photo-based solutions with guided steps
Explore more problems and detailed explanations
Five-Number Summary:
Min: 5.00, Q1: 6.00, Median: 11.00, Q3: 15.00, Max: 15.00
Correct Boxplot:
The first boxplot (with x-axis ranging from 5 to 15, box spanning 6 to 15, median line at 11)