QUESTION IMAGE
Question
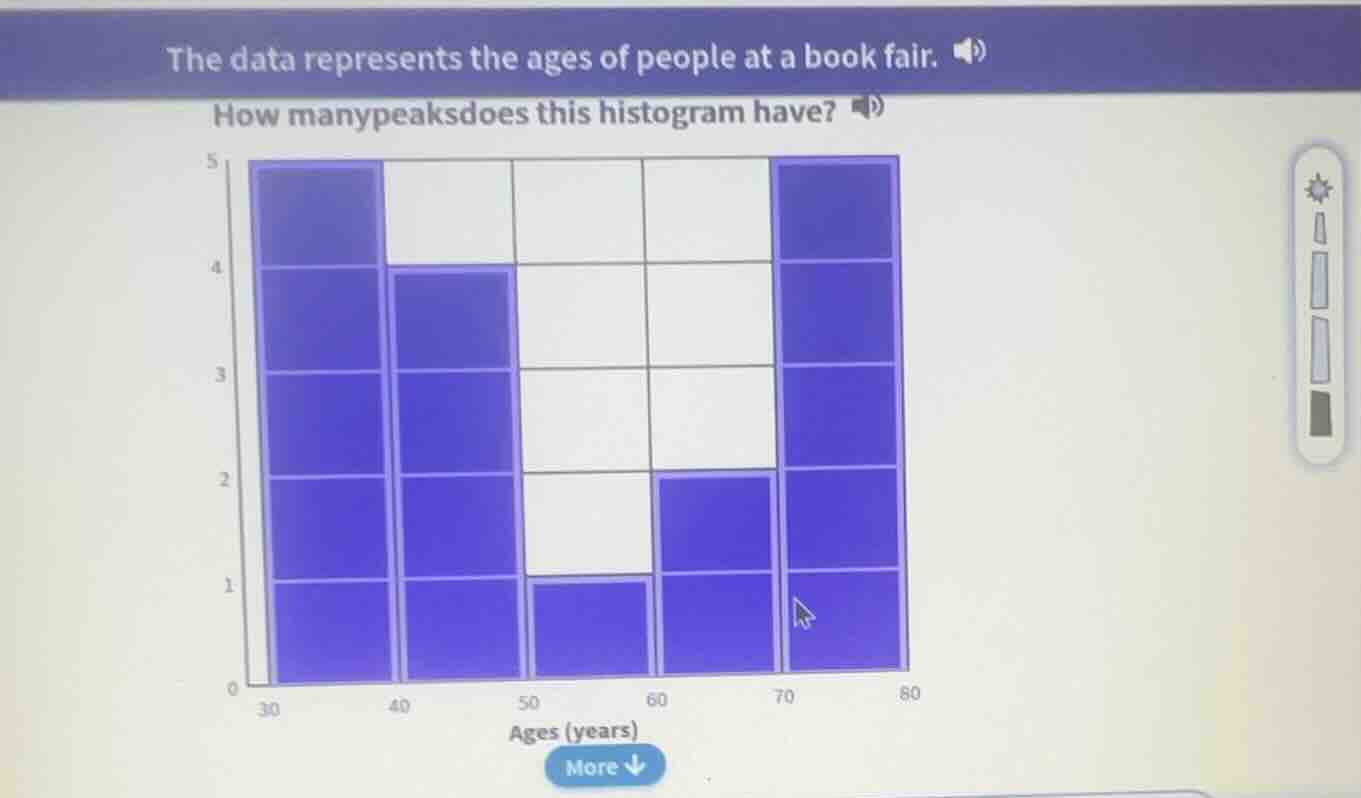
the data represents the ages of people at a book fair. how many peaks does this histogram have?
Step1: Define a peak in a histogram
A peak in a histogram is a bar that is taller than the adjacent bars (to the left and right). We examine each bar's height relative to its neighbors.
Step2: Analyze each bar group
- The first bar (30 - 40 age group) has height 5. The next bar (40 - 50) has height 4, so the first bar is a peak? Wait, no, wait. Wait, the peak is a local maximum. Let's check each:
- 30 - 40: height 5. Next bar (40 - 50) is 4 (lower), previous? None (leftmost). Wait, but then 40 - 50: height 4. Next (50 - 60) is 1 (lower), previous is 5 (higher) – so not a peak. 50 - 60: height 1. Next (60 - 70) is 2 (higher), previous is 4 (higher) – not a peak. 60 - 70: height 2. Next (70 - 80) is 5 (higher), previous is 1 (lower) – not a peak. 70 - 80: height 5. Previous (60 - 70) is 2 (lower), next? None (rightmost). Wait, but also, the 30 - 40 (height 5) and 70 - 80 (height 5) – are these peaks? Wait, a peak is a local maximum. So for 30 - 40: left has no bar, right is 4 (lower) – so local max. For 70 - 80: right has no bar, left is 2 (lower) – local max. Wait, but also, is there a middle peak? Wait no, the 30 - 40 (height 5), 40 - 50 (4), 50 - 60 (1), 60 - 70 (2), 70 - 80 (5). So the two bars with height 5 (30 - 40 and 70 - 80) are local maxima (peaks), and also, wait, is there a third? No, because 40 - 50 is 4 (less than 5 and 5), 50 - 60 is 1, 60 - 70 is 2. Wait, but actually, in a histogram, a peak is a bar that is higher than its immediate neighbors. So 30 - 40: right neighbor is 4 (lower) – peak. 70 - 80: left neighbor is 2 (lower) – peak. Wait, but also, is the 30 - 40 and 70 - 80, and is there another? Wait, no, the 30 - 40 (height 5), 40 - 50 (4), 50 - 60 (1), 60 - 70 (2), 70 - 80 (5). So the two bars with height 5 are peaks, and also, wait, maybe I made a mistake. Wait, the definition of a peak in a histogram is a bar that is higher than the bars immediately adjacent to it (left and right). So for the first bar (30 - 40), it has a right neighbor (40 - 50) with height 4 (lower), so it's a peak. For the last bar (70 - 80), left neighbor (60 - 70) with height 2 (lower), so it's a peak. Wait, but also, is there a third peak? No, because the middle bars are lower. Wait, but maybe the problem considers a peak as a cluster? Wait, no, the question is "how many peaks does this histogram have?". A peak is a local maximum. So let's list the heights:
- 30 - 40: 5
- 40 - 50: 4
- 50 - 60: 1
- 60 - 70: 2
- 70 - 80: 5
So the local maxima are at 30 - 40 (since 5 > 4) and 70 - 80 (since 5 > 2). Wait, but also, is 30 - 40 a peak (leftmost, so only right neighbor), and 70 - 80 (rightmost, only left neighbor). So these two are peaks. Wait, but maybe I miscounted. Wait, no, the 30 - 40 (height 5) and 70 - 80 (height 5) – both are higher than their adjacent bars. So the number of peaks is 2? Wait, no, wait the original histogram: let me check again. The first bar (30 - 40) is height 5, next (40 - 50) is 4, then 50 - 60 is 1, 60 - 70 is 2, 70 - 80 is 5. So the peaks are the bars where the height is greater than the bar to the left and right (or, for the first bar, greater than the bar to the right; for the last bar, greater than the bar to the left). So 30 - 40: greater than right (4 < 5) – peak. 70 - 80: greater than left (2 < 5) – peak. So two peaks? Wait, but maybe the answer is 2? Wait, no, wait, maybe I made a mistake. Wait, the 30 - 40 (height 5), 40 - 50 (4), 50 - 60 (1), 60 - 70 (2), 70 - 80 (5). So the two bars with height 5 are peaks. So the number of peaks is 2? Wait, but let me confirm the definition of a peak in a histo…

Snap & solve any problem in the app
Get step-by-step solutions on Sovi AI
Photo-based solutions with guided steps
Explore more problems and detailed explanations
2