QUESTION IMAGE
Question
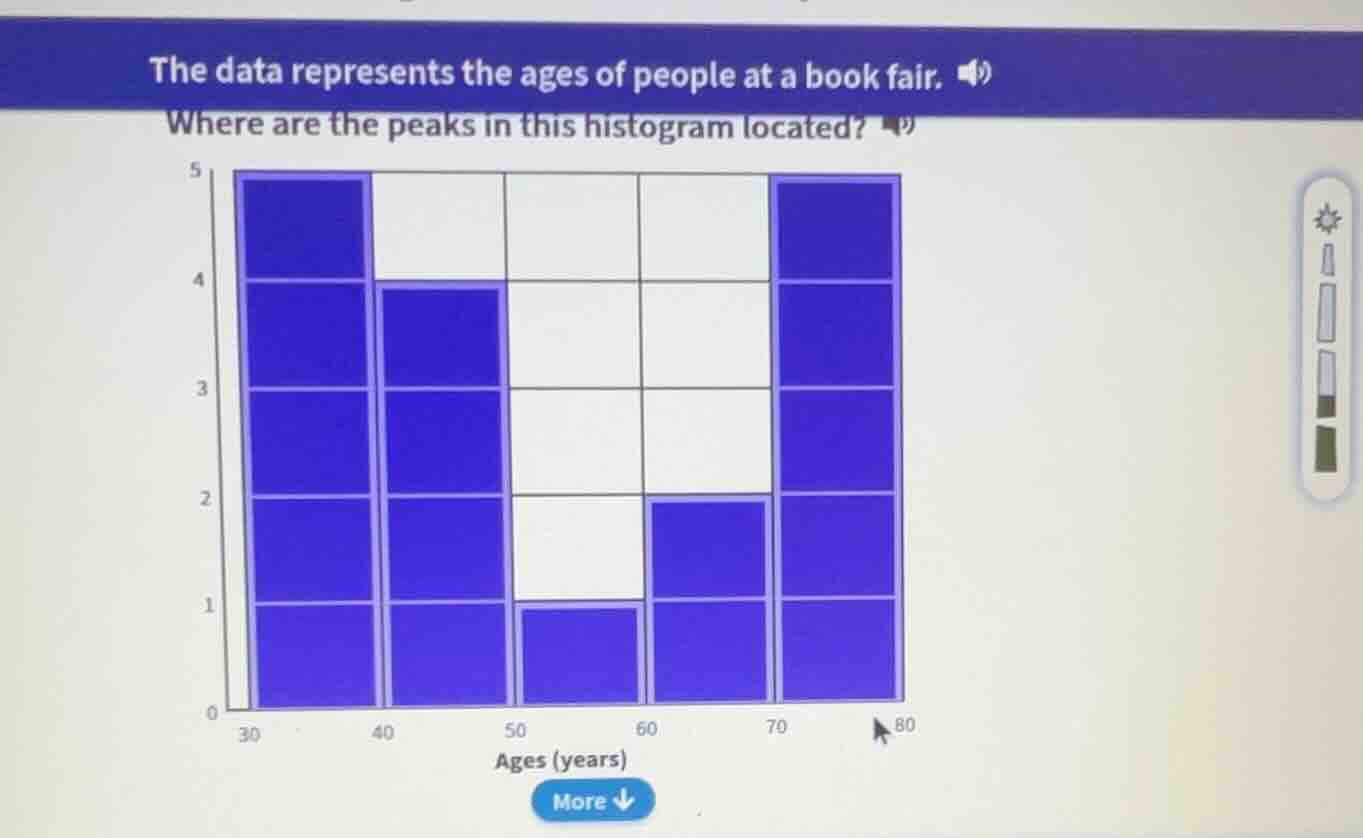
the data represents the ages of people at a book fair. where are the peaks in this histogram located?
Step1: Understand Histogram Peaks
A peak in a histogram is a bar (or interval) with the highest frequency (tallest bar). We analyze each age interval's bar height.
Step2: Analyze Each Interval
- 30 - 40 years: Bar height is 5 (tallest here? Wait, check 70 - 80 too). Wait, the first bar (30 - 40) has height 5, the last bar (70 - 80) also has height 5? Wait, no, let's re - check. Wait, the x - axis is 30, 40, 50, 60, 70, 80. So intervals: 30 - 40, 40 - 50, 50 - 60, 60 - 70, 70 - 80.
- 30 - 40: Height 5.
- 40 - 50: Height 4.
- 50 - 60: Height 1.
- 60 - 70: Height 2.
- 70 - 80: Height 5.
Wait, but looking at the histogram, the first bar (30 - 40) and the last bar (70 - 80) have the highest height (5). Wait, but maybe I misread. Wait, the y - axis is from 0 to 5. The first bar (30 - 40) reaches up to 5, the last bar (70 - 80) also reaches up to 5. Wait, but maybe the intervals are 30 - 40, 40 - 50, 50 - 60, 60 - 70, 70 - 80. Wait, no, the x - axis labels are 30, 40, 50, 60, 70, 80. So each bar is between two consecutive labels. So 30 - 40, 40 - 50, 50 - 60, 60 - 70, 70 - 80.
Looking at the heights:
- 30 - 40: 5 units (since y - axis goes from 0 to 5, and the bar is at the top).
- 40 - 50: 4 units.
- 50 - 60: 1 unit.
- 60 - 70: 2 units.
- 70 - 80: 5 units.
Wait, but maybe the first bar is 30 - 40 and the last bar is 70 - 80, both with height 5. But maybe the question is about the peaks. Wait, maybe I made a mistake. Wait, the first bar (30 - 40) and the last bar (70 - 80) have the maximum height (5). But let's check again. The y - axis is 0,1,2,3,4,5. The first bar (30 - 40) is filled up to 5, the last bar (70 - 80) is also filled up to 5. The 40 - 50 bar is up to 4, 50 - 60 up to 1, 60 - 70 up to 2. So the peaks are at the intervals 30 - 40 and 70 - 80? Wait, no, maybe the x - axis is 30 - 40, 40 - 50, 50 - 60, 60 - 70, 70 - 80. Wait, but maybe the first bar is 30 - 40 (height 5) and the last bar is 70 - 80 (height 5). But maybe the answer is 30 - 40 and 70 - 80? Wait, no, maybe I misread the histogram. Wait, the first bar (30 - 40) has height 5, the last bar (70 - 80) has height 5. So the peaks are at the age intervals of 30 - 40 years and 70 - 80 years.

Snap & solve any problem in the app
Get step-by-step solutions on Sovi AI
Photo-based solutions with guided steps
Explore more problems and detailed explanations
The peaks are located in the age intervals of 30 - 40 years and 70 - 80 years.