QUESTION IMAGE
Question
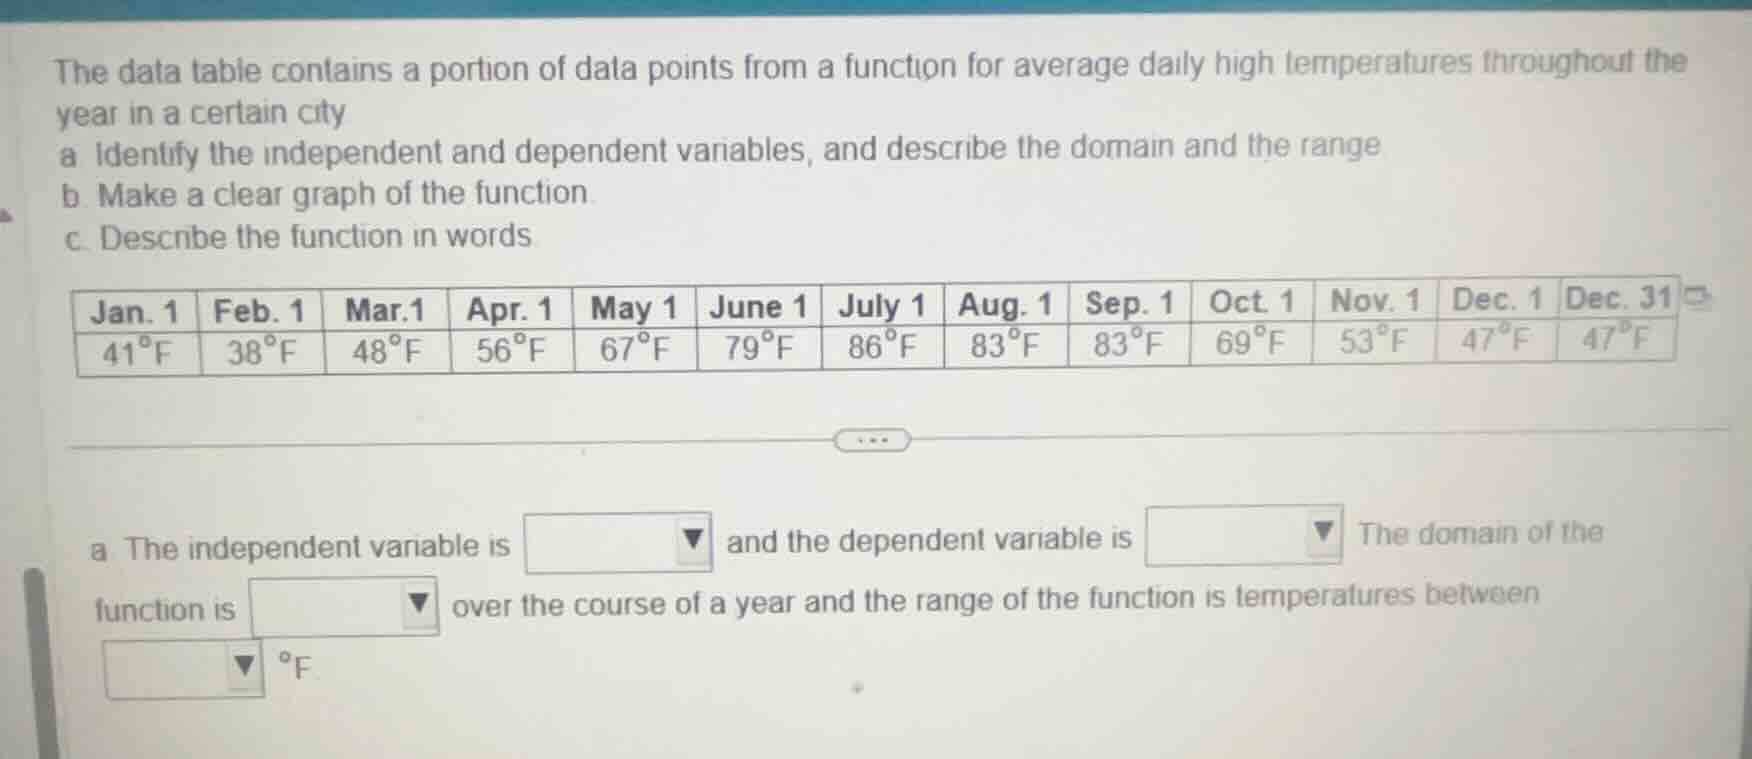
the data table contains a portion of data points from a function for average daily high temperatures throughout the year in a certain city
a identify the independent and dependent variables, and describe the domain and the range
b make a clear graph of the function
c describe the function in words
jan. 1 feb. 1 mar.1 apr. 1 may 1 june 1 july 1 aug. 1 sep. 1 oct. 1 nov. 1 dec. 1 dec. 31
41°f 38°f 48°f 56°f 67°f 79°f 86°f 83°f 83°f 69°f 53°f 47°f 47°f
a the independent variable is and the dependent variable is the domain of the
function is over the course of a year and the range of the function is temperatures between
°f
Part (a)
- Independent Variable: In a function, the independent variable is the one that is manipulated or is the input. Here, the dates (time, specifically different days/dates in the year) are the independent variable because we are looking at temperature as it changes over these dates.
- Dependent Variable: The dependent variable depends on the independent variable. The average daily high temperature depends on the date, so temperature is the dependent variable.
- Domain: The domain is the set of all possible input values (independent variable values). Here, the input is the dates throughout the year (from Jan 1 to Dec 31, and the intermediate dates like Feb 1, Mar 1, etc.). So the domain is the set of dates (or time) over the course of a year.
- Range: The range is the set of all possible output values (dependent variable values). To find the range, we look at the minimum and maximum temperatures. The minimum temperature from the data is \(38^\circ\text{F}\) (Feb 1) and the maximum is \(86^\circ\text{F}\) (July 1). Wait, wait, let's check the data again: Jan 1: 41, Feb 1: 38, Mar 1: 48, Apr 1: 56, May 1: 67, June 1: 79, July 1: 86, Aug 1: 83, Sep 1: 83, Oct 1: 69, Nov 1: 53, Dec 1: 47, Dec 31: 47. So the minimum temperature is \(38^\circ\text{F}\) (Feb 1) and the maximum is \(86^\circ\text{F}\) (July 1). Wait, but also check Dec 1 and Dec 31: 47, Nov 1: 53, Oct 1: 69, Sep 1: 83, Aug 1: 83, July 1: 86, June 1: 79, May 1: 67, Apr 1: 56, Mar 1: 48, Jan 1: 41, Feb 1: 38. So the lowest is 38, highest is 86. Wait, but let's confirm: 38 (Feb 1), then 41 (Jan 1), 48 (Mar 1), 56 (Apr 1), 67 (May 1), 79 (June 1), 86 (July 1), 83 (Aug 1), 83 (Sep 1), 69 (Oct 1), 53 (Nov 1), 47 (Dec 1), 47 (Dec 31). So the minimum temperature is \(38^\circ\text{F}\) and the maximum is \(86^\circ\text{F}\). So the range is temperatures between \(38^\circ\text{F}\) and \(86^\circ\text{F}\) (inclusive, since those values are in the data).
Step 1: Identify Independent and Dependent Variables
The independent variable is the date (or time, represented by the different days like Jan 1, Feb 1, etc.) because it is the input we use to determine the temperature. The dependent variable is the average daily high temperature because it depends on the date.
Step 2: Determine Domain
The domain consists of the dates (or time) over the course of a year. Specifically, the dates from January 1 to December 31 (including the intermediate dates like Feb 1, Mar 1, etc. as given in the table).
Step 3: Determine Range
To find the range, we find the minimum and maximum values of the dependent variable (temperature). From the data:
- Minimum temperature: \(38^\circ\text{F}\) (Feb 1)
- Maximum temperature: \(86^\circ\text{F}\) (July 1)
So the range is temperatures between \(38^\circ\text{F}\) and \(86^\circ\text{F}\) (inclusive, since these values are present in the data).
Part (b)
To make a graph of the function:
- X - axis (Independent Variable): Use the dates (Jan 1, Feb 1, Mar 1, Apr 1, May 1, June 1, July 1, Aug 1, Sep 1, Oct 1, Nov 1, Dec 1, Dec 31) as the x - values. You can label them in order along the x - axis.
- Y - axis (Dependent Variable): Use temperature (in \(^\circ\text{F}\)) as the y - values.
- Plot the Points: For each date, plot a point with the corresponding temperature. For example:
- Jan 1: (Jan 1, 41)
- Feb 1: (Feb 1, 38)
- Mar 1: (Mar 1, 48)
- Apr 1: (Apr 1, 56)
- May 1: (May 1, 67)
- June 1: (June 1, 79)
- July 1: (July 1, 86)
- Aug 1: (Aug 1, 83)
- Sep 1: (Sep 1, 83)
- Oct 1: (Oct 1, 69)
- Nov 1: (Nov 1, 53)
- Dec 1: (Dec 1, 47)
- Dec 31: (Dec 31, 47)
- Connect the Points: Draw a line (or a curve) connecting these points in the order of the dates to show the trend of the temperature over the year.
Part (c)
The function represents the average daily high temperature as a function of the date (time) over the course of a year. The temperature starts at \(41^\circ\text{F}\) on January 1, decreases to \(38^\circ\text{F}\) on February 1, then increases steadily from February 1 to July 1, reaching a peak of \(86^\circ\text{F}\) on July 1. After July 1, the temperature remains relatively high ( \(83^\circ\text{F}\) in August and September) and then starts to decrease from September to November, reaching \(53^\circ\text{F}\) on November 1, and then decreases further to \(47^\circ\text{F}\) on December 1 and remains at \(47^\circ\text{F}\) on December 31. In summary, the temperature has a general pattern of decreasing slightly in the early winter (Jan - Feb), then increasing through spring and summer, reaching a peak in summer (July), remaining high in late summer, and then decreasing through fall and winter.
Final Answers for Part (a)
- Independent variable: Date (or time, represented by the different days in the year)
- Dependent variable: Average daily high temperature
- Domain: The set of dates (from January 1 to December 31, including the intermediate dates as given) over the course of a year
- Range: Temperatures between \(38^\circ\text{F}\) and \(86^\circ\text{F}\) (inclusive)
(For the graph in part (b), you would have a coordinate system with dates on the x - axis and temperature on the y - axis, with points plotted as described and connected.)
(For the description in part (c), the above - mentioned description of the temperature trend over the year based on the date is the answer.)

Snap & solve any problem in the app
Get step-by-step solutions on Sovi AI
Photo-based solutions with guided steps
Explore more problems and detailed explanations
The function represents the average daily high temperature as a function of the date (time) over the course of a year. The temperature starts at \(41^\circ\text{F}\) on January 1, decreases to \(38^\circ\text{F}\) on February 1, then increases steadily from February 1 to July 1, reaching a peak of \(86^\circ\text{F}\) on July 1. After July 1, the temperature remains relatively high ( \(83^\circ\text{F}\) in August and September) and then starts to decrease from September to November, reaching \(53^\circ\text{F}\) on November 1, and then decreases further to \(47^\circ\text{F}\) on December 1 and remains at \(47^\circ\text{F}\) on December 31. In summary, the temperature has a general pattern of decreasing slightly in the early winter (Jan - Feb), then increasing through spring and summer, reaching a peak in summer (July), remaining high in late summer, and then decreasing through fall and winter.
Final Answers for Part (a)
- Independent variable: Date (or time, represented by the different days in the year)
- Dependent variable: Average daily high temperature
- Domain: The set of dates (from January 1 to December 31, including the intermediate dates as given) over the course of a year
- Range: Temperatures between \(38^\circ\text{F}\) and \(86^\circ\text{F}\) (inclusive)
(For the graph in part (b), you would have a coordinate system with dates on the x - axis and temperature on the y - axis, with points plotted as described and connected.)
(For the description in part (c), the above - mentioned description of the temperature trend over the year based on the date is the answer.)