QUESTION IMAGE
Question
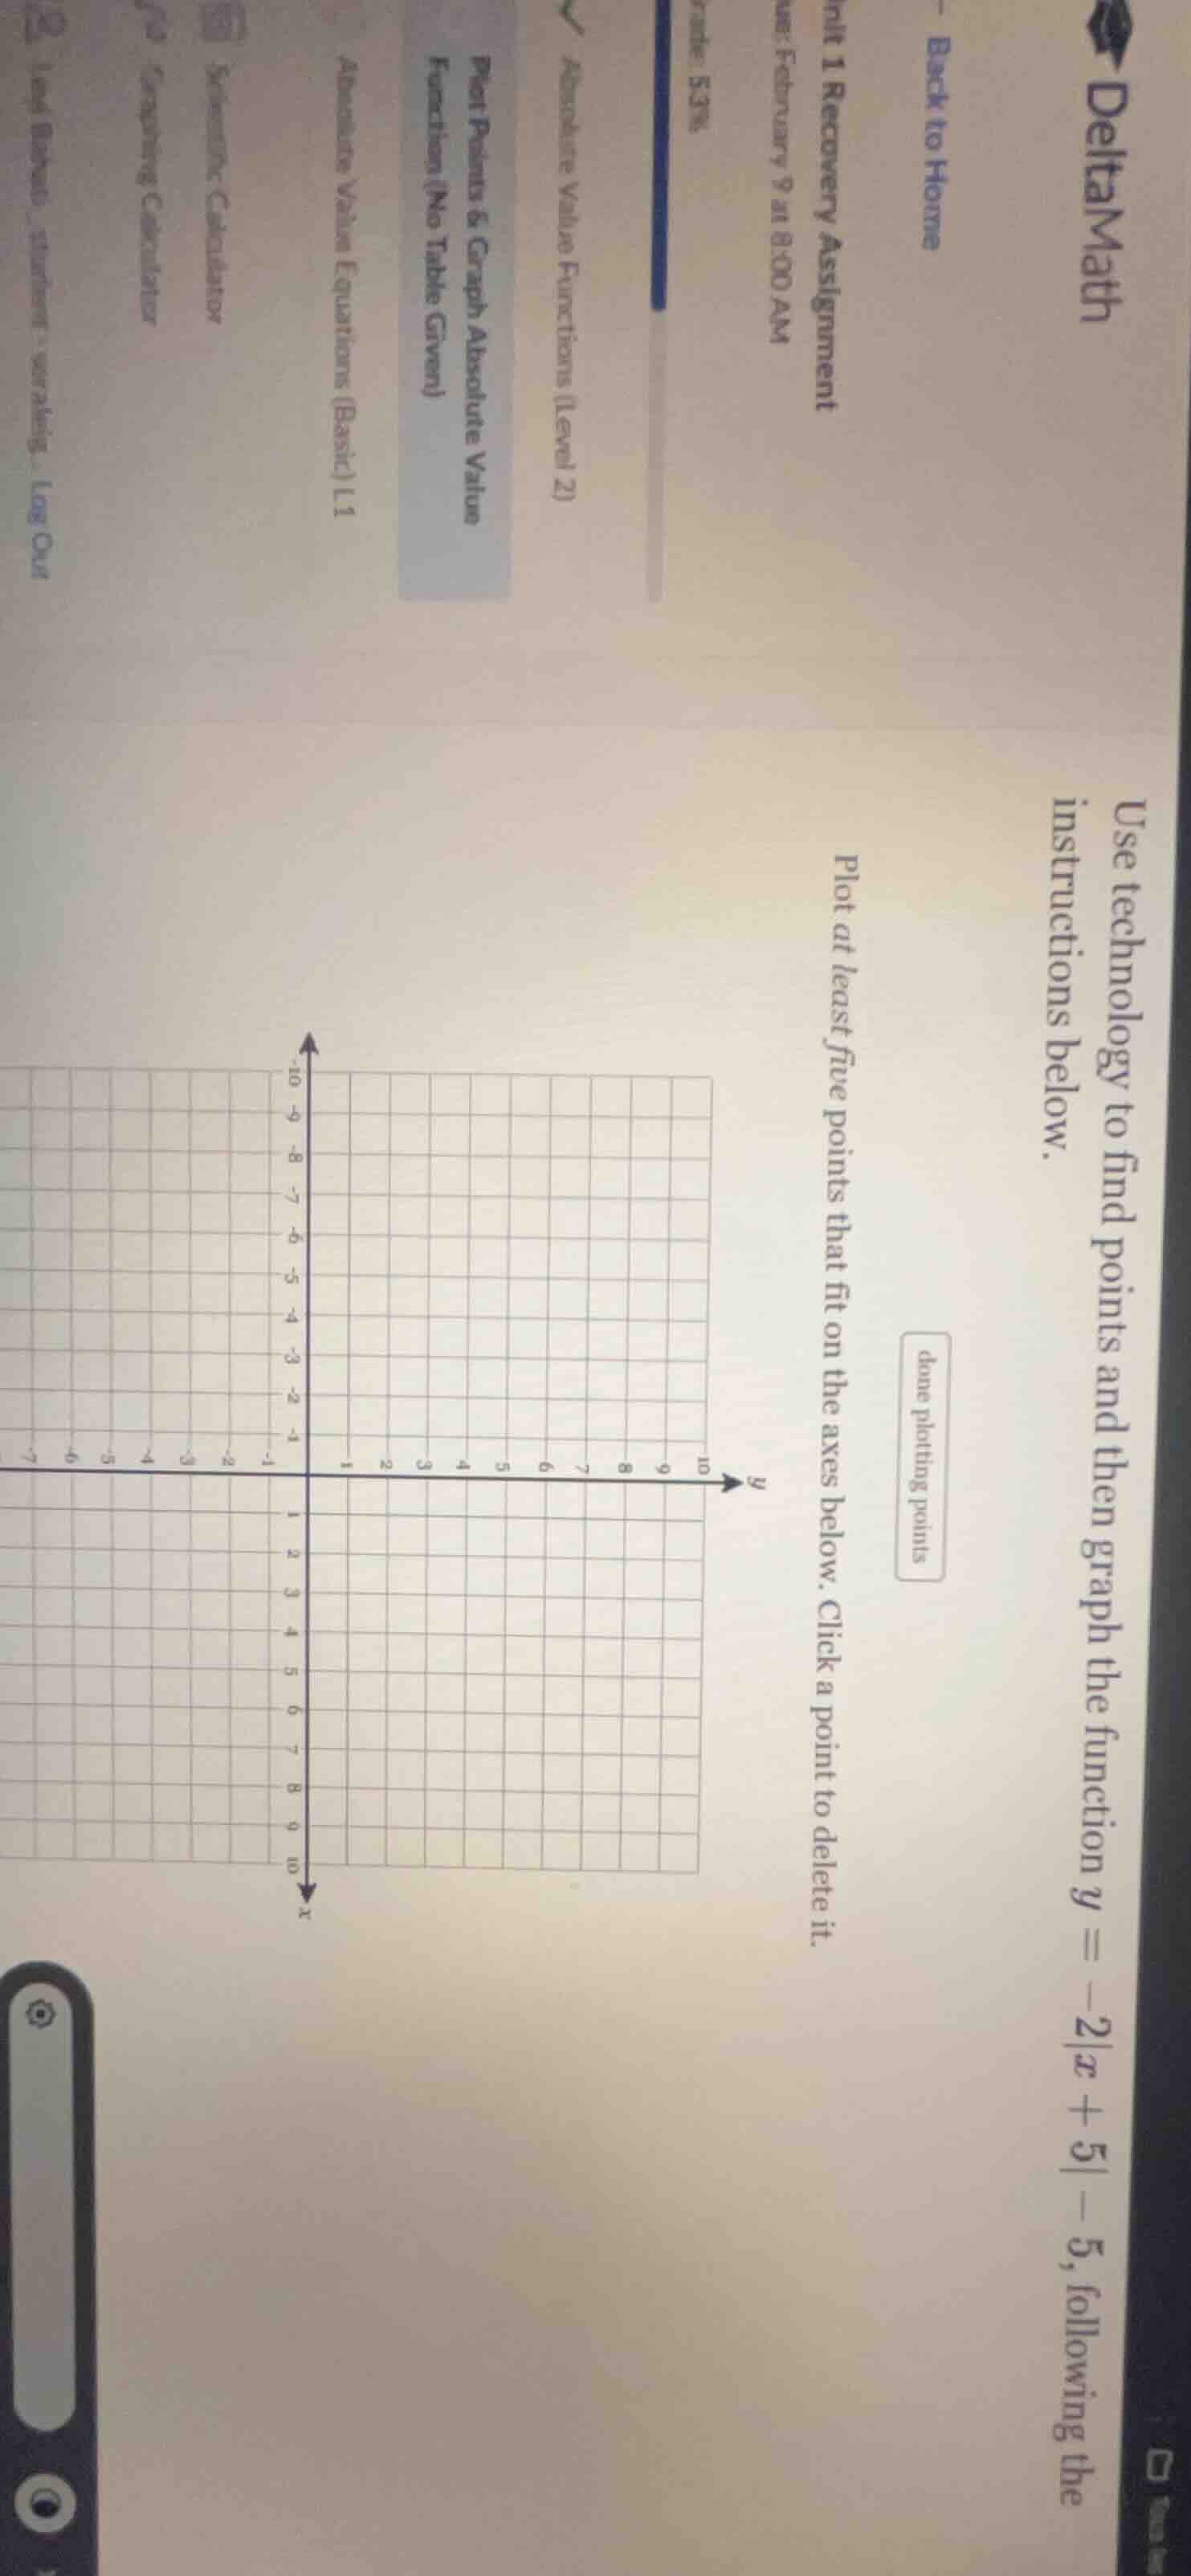
deltamath back to home nlt 1 recovery assignment e: february 9 at 8:00 am rade: 53% absolute value functions (level 2) plot points & graph absolute value function (no table given) absolute value equations (basic) (l1 scientific calculator graphing calculator log out use technology to find points and then graph the function ( y = -2|x + 5| - 5 ), following the instructions below. plot at least five points that fit on the axes below. click a point to delete it. done plotting points
Step1: Find vertex of the function
The vertex of $y=a|x-h|+k$ is at $(h,k)$. For $y=-2|x+5|-5$, rewrite as $y=-2|x-(-5)|+(-5)$, so vertex is $(-5, -5)$.
Step2: Choose x-values left of vertex
Pick $x=-7$:
$y=-2|-7+5|-5=-2|-2|-5=-2(2)-5=-4-5=-9$
Point: $(-7, -9)$
Pick $x=-6$:
$y=-2|-6+5|-5=-2|-1|-5=-2(1)-5=-2-5=-7$
Point: $(-6, -7)$
Step3: Choose x-values right of vertex
Pick $x=-4$:
$y=-2|-4+5|-5=-2|1|-5=-2(1)-5=-2-5=-7$
Point: $(-4, -7)$
Pick $x=-3$:
$y=-2|-3+5|-5=-2|2|-5=-2(2)-5=-4-5=-9$
Point: $(-3, -9)$
Step4: List all 5 points
Compile the vertex and four calculated points.

Snap & solve any problem in the app
Get step-by-step solutions on Sovi AI
Photo-based solutions with guided steps
Explore more problems and detailed explanations
The five points to plot are:
$(-7, -9)$, $(-6, -7)$, $(-5, -5)$, $(-4, -7)$, $(-3, -9)$
(Connect these points to form the V-shaped graph of the absolute value function, opening downward)