QUESTION IMAGE
Question
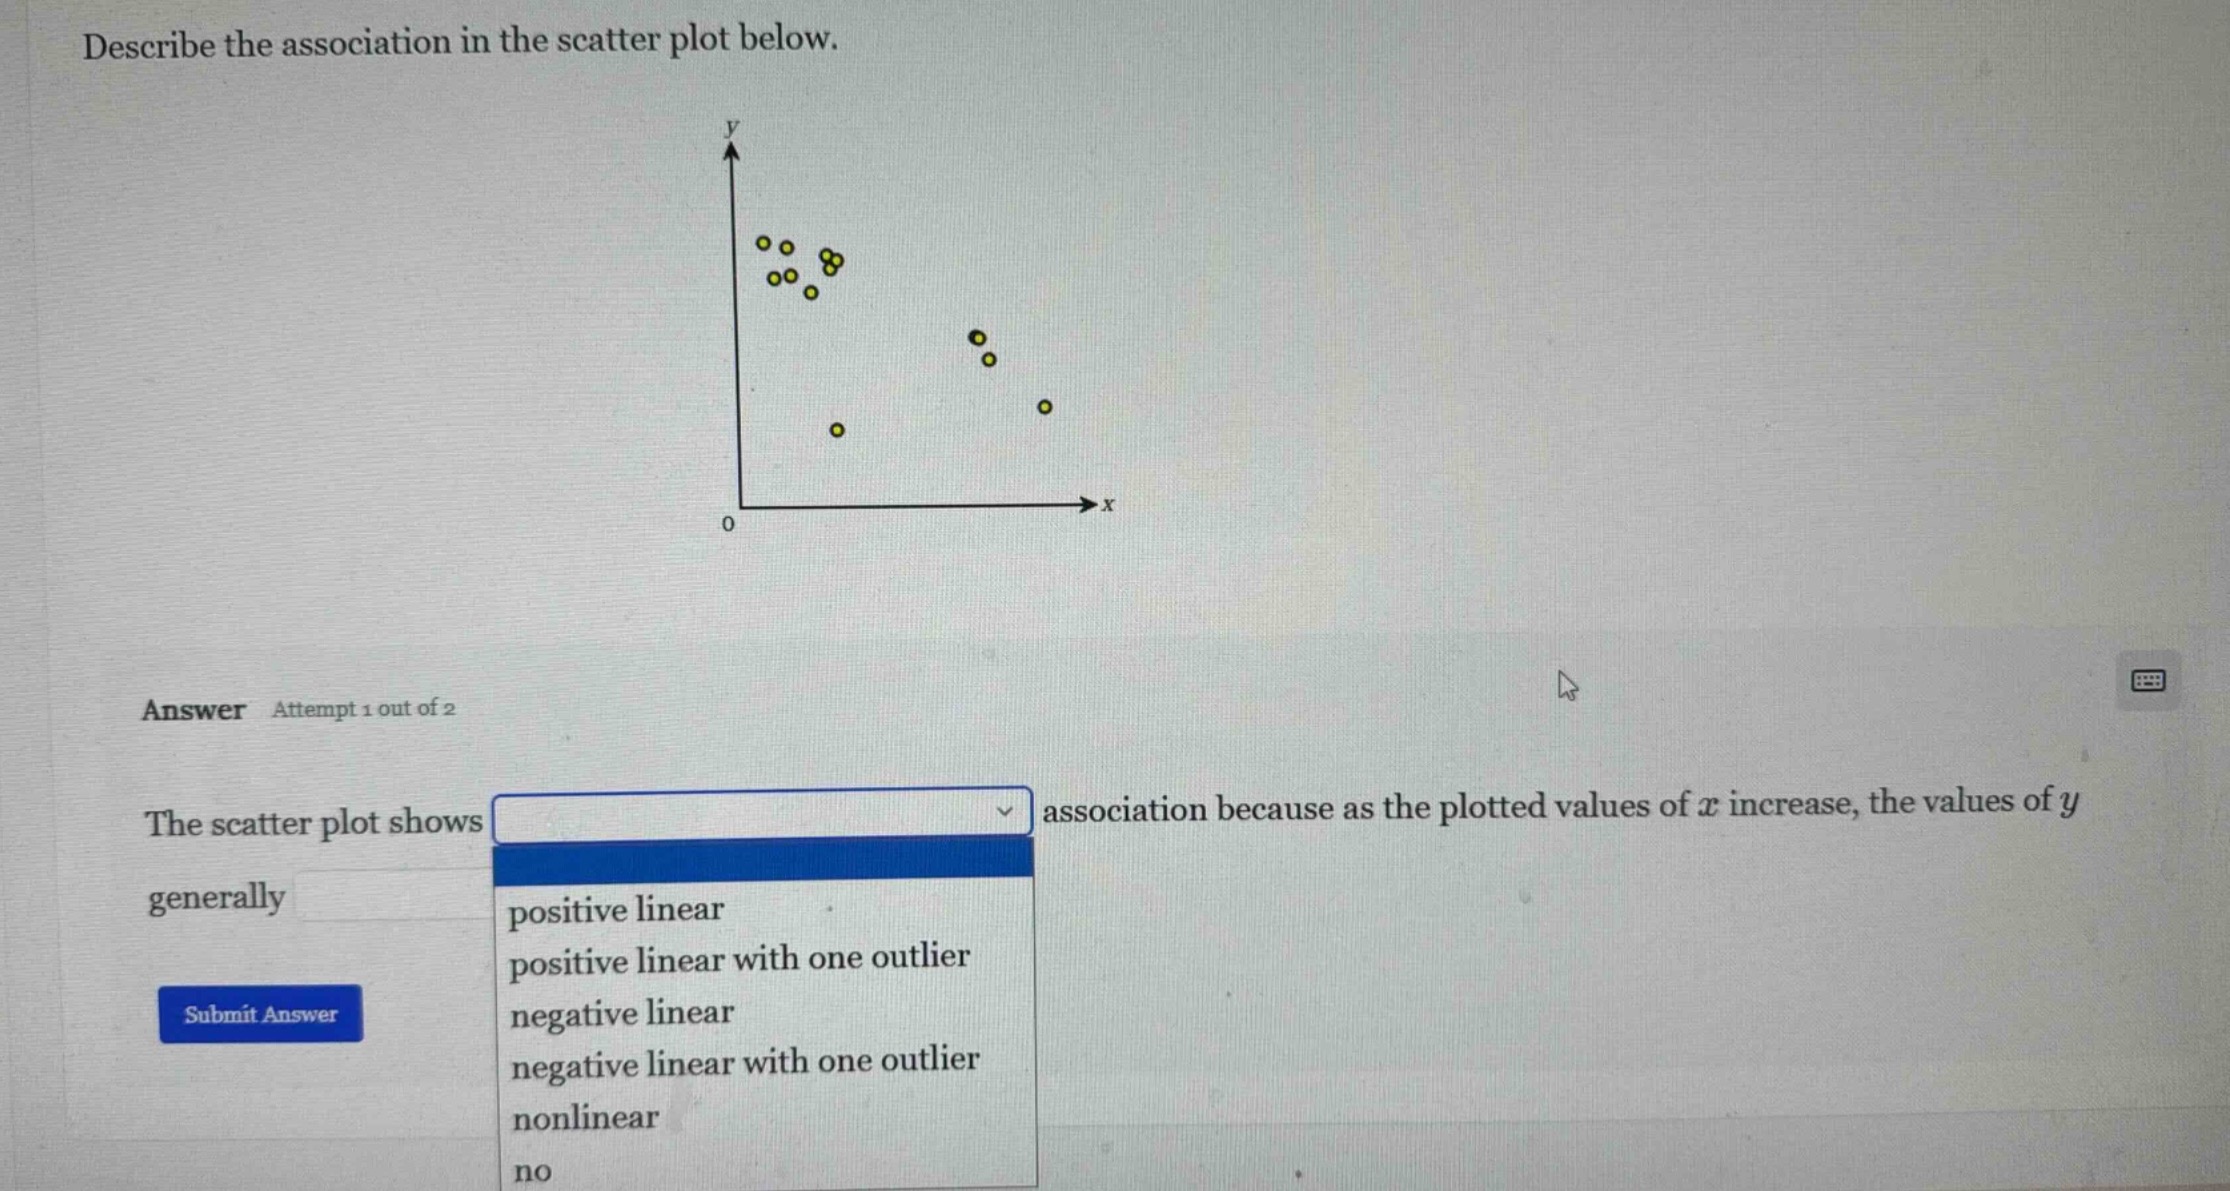
describe the association in the scatter plot below.
answer attempt 1 out of 2
the scatter plot shows association because as the plotted values of ( x ) increase, the values of ( y ) generally
positive linear
positive linear with one outlier
negative linear
negative linear with one outlier
nonlinear
no
Brief Explanations
To determine the association, we analyze the scatter plot:
- Direction of Association: As \( x \) increases, \( y \) generally decreases. This indicates a negative linear trend.
- Outlier Check: There is one point (the lower - left point relative to the main cluster) that deviates from the general negative linear pattern, so we have a negative linear association with one outlier.

Snap & solve any problem in the app
Get step-by-step solutions on Sovi AI
Photo-based solutions with guided steps
Explore more problems and detailed explanations
The scatter plot shows negative linear with one outlier association because as the plotted values of \( x \) increase, the values of \( y \) generally decrease.