QUESTION IMAGE
Question
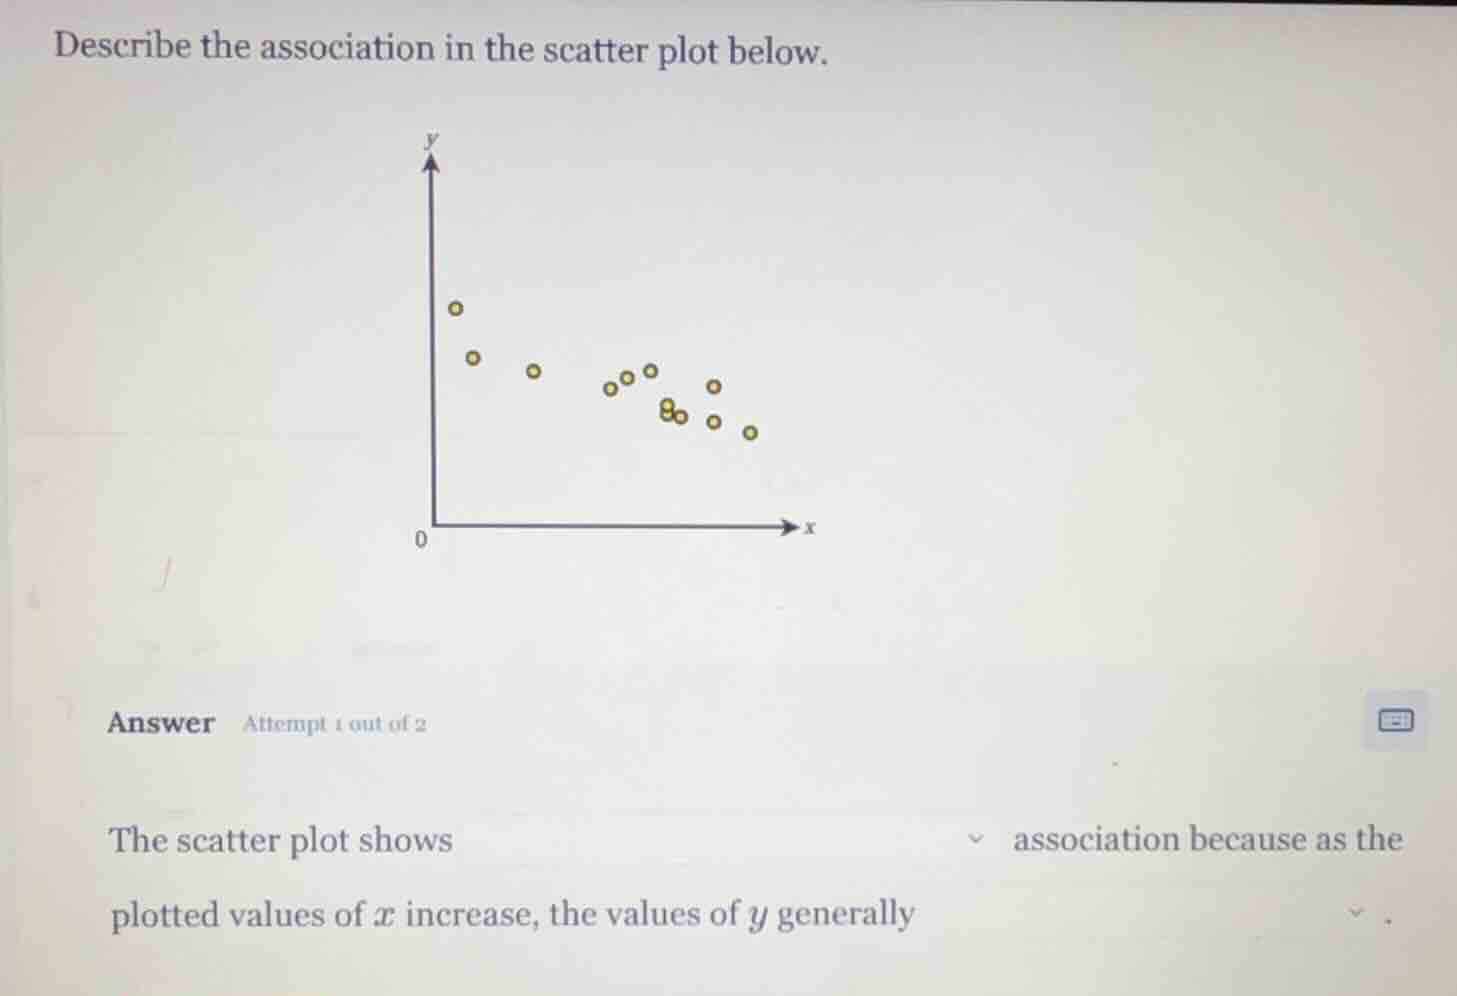
describe the association in the scatter plot below.
answer attempt 1 out of 2
the scatter plot shows association because as the
plotted values of $x$ increase, the values of $y$ generally .
A scatter plot's association is described by direction and strength. Here, as x increases, y tends to decrease, and the points follow a clear downward trend without extreme scattering, indicating a moderate negative linear association.

Snap & solve any problem in the app
Get step-by-step solutions on Sovi AI
Photo-based solutions with guided steps
Explore more problems and detailed explanations
The scatter plot shows a moderate negative linear association because as the plotted values of $x$ increase, the values of $y$ generally decrease in a roughly linear pattern.