QUESTION IMAGE
Question
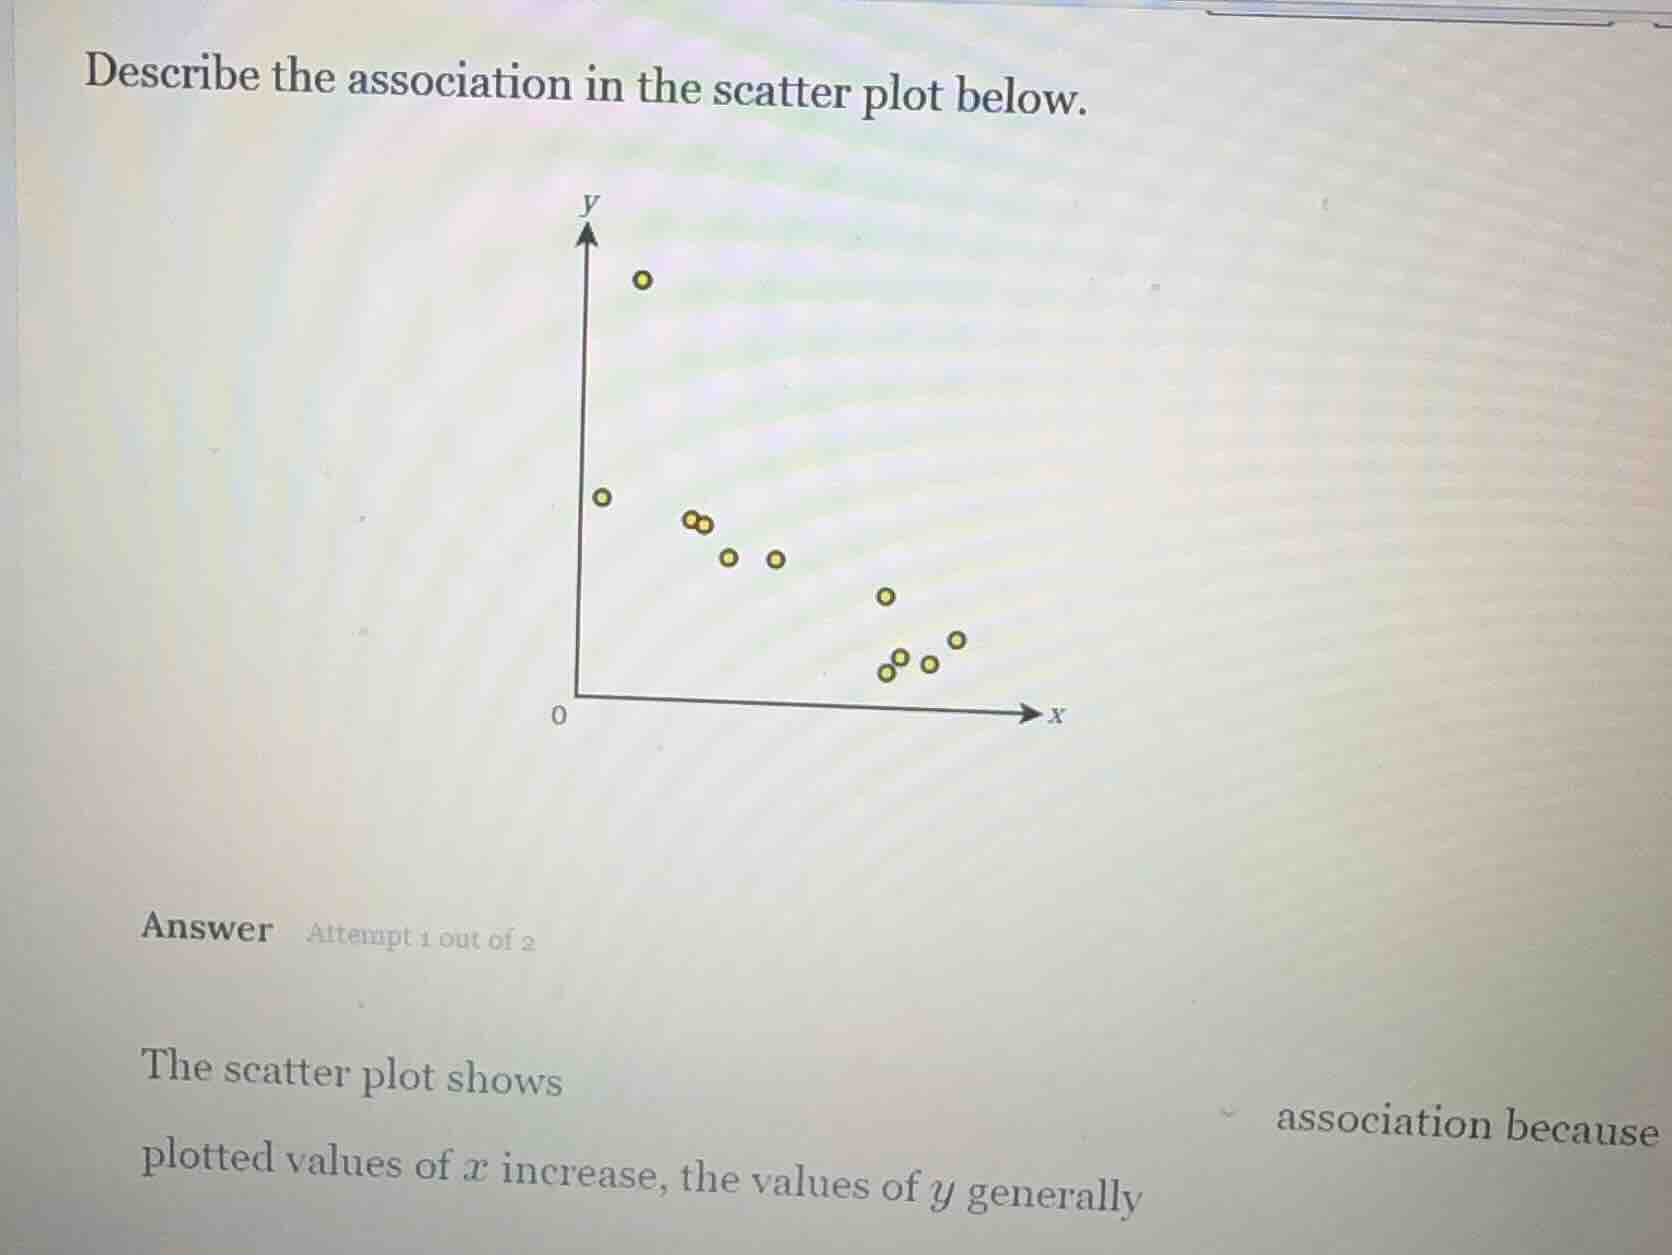
describe the association in the scatter plot below.
the scatter plot shows association because plotted values of ( x ) increase, the values of ( y ) generally
To describe the association in a scatter plot, we analyze the direction (positive or negative), form (linear or non - linear), and strength (strong, moderate, weak) of the relationship between the two variables \(x\) and \(y\).
- Direction: As the value of \(x\) (the independent variable on the horizontal axis) increases, we observe the trend of the \(y\) - values (the dependent variable on the vertical axis). In this scatter plot, when \(x\) increases, the \(y\) - values generally decrease. This indicates a negative association.
- Form: The points seem to follow a somewhat linear pattern (even though there might be a bit of scatter, the overall trend is linear).
- Strength: The points are not perfectly aligned, but they show a relatively clear trend. So we can say it is a negative, linear (or somewhat linear) association with a moderate to strong trend (since the points follow the decreasing pattern fairly closely).

Snap & solve any problem in the app
Get step-by-step solutions on Sovi AI
Photo-based solutions with guided steps
Explore more problems and detailed explanations
The scatter plot shows a negative association because as the plotted values of \(x\) increase, the values of \(y\) generally decrease. The association can also be described as linear (or somewhat linear) as the points follow a general decreasing linear trend.