QUESTION IMAGE
Question
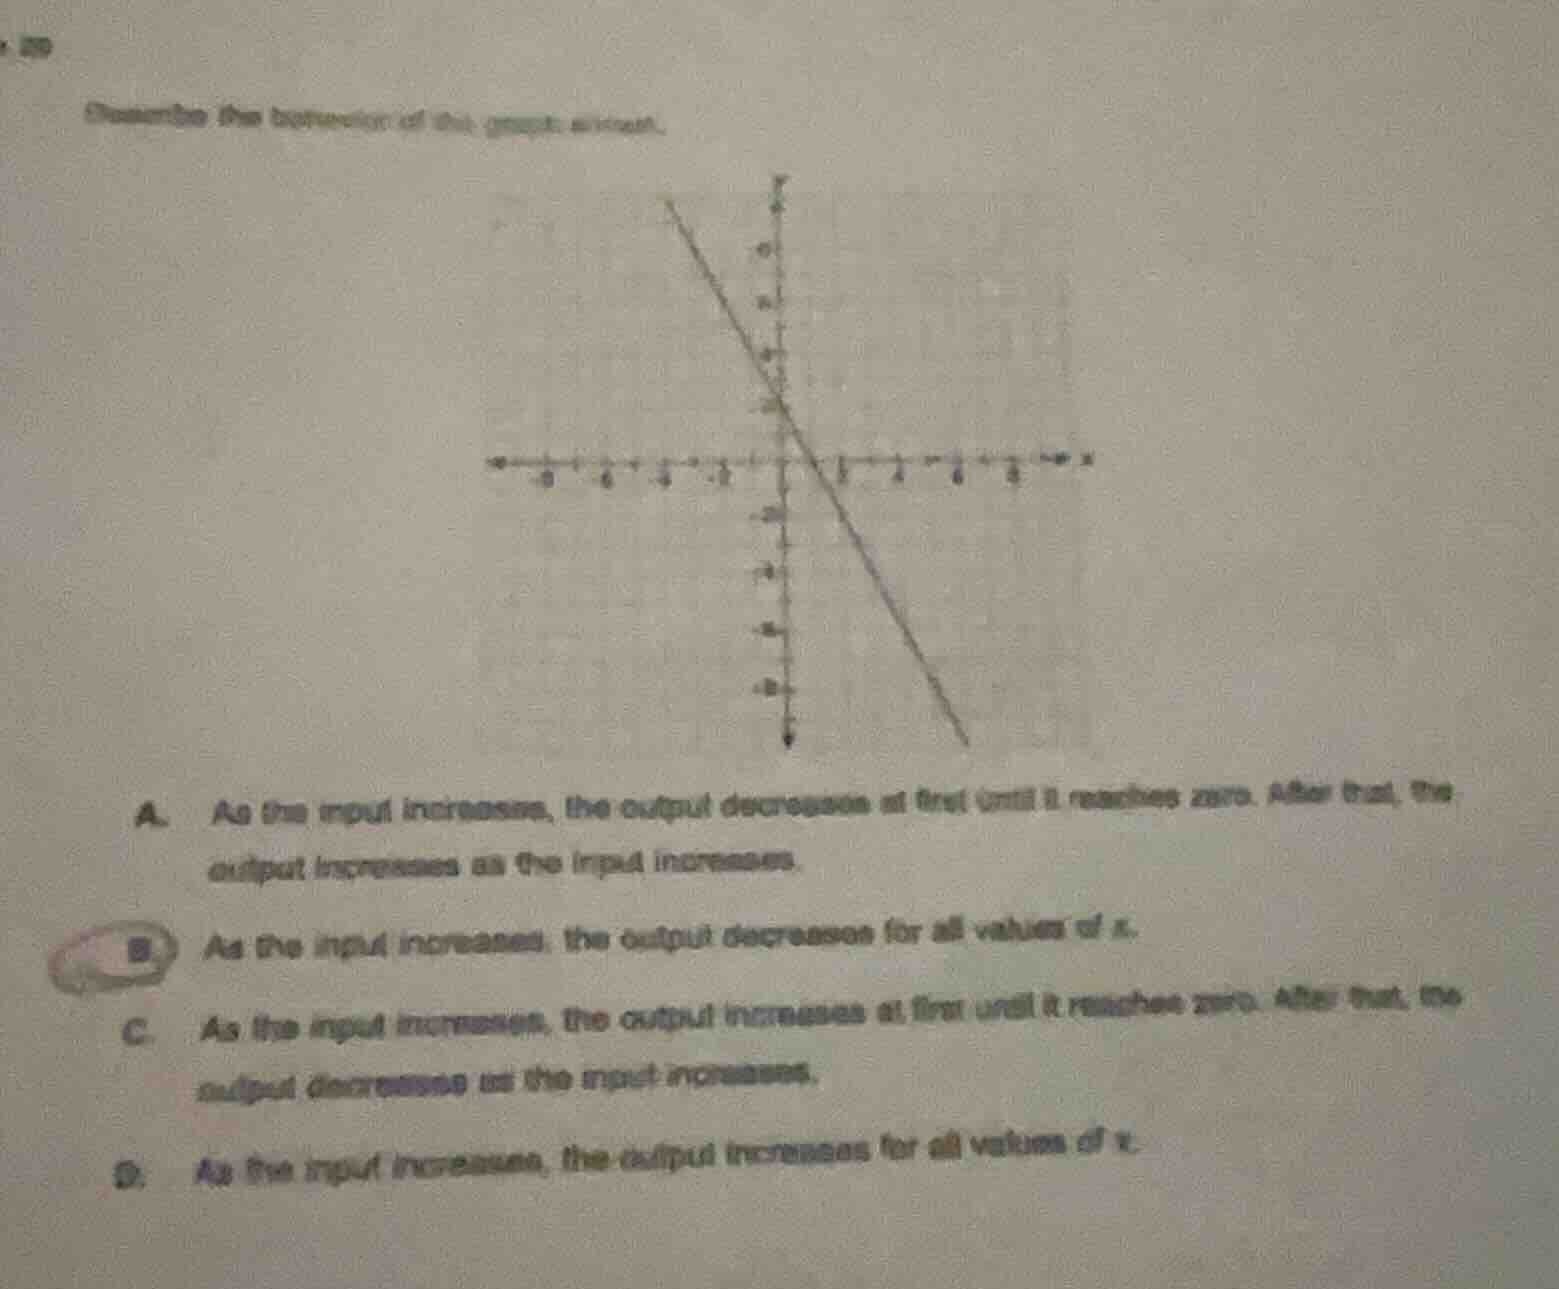
describe the behavior of this graph shown.a. as the input increases, the output decreases at first until it reaches zero. after that, the output increases as the input increases.b. as the input increases, the output decreases for all values of x.c. as the input increases, the output increases at first until it reaches zero. after that, the output decreases as the input increases.d. as the input increases, the output increases for all values of x.
The graph is a straight line with a negative slope, meaning as the input (x-value) increases across all its domain, the output (y-value) consistently decreases. This matches option B.

Snap & solve any problem in the app
Get step-by-step solutions on Sovi AI
Photo-based solutions with guided steps
Explore more problems and detailed explanations
B. As the input increases, the output decreases for all values of x.