QUESTION IMAGE
Question
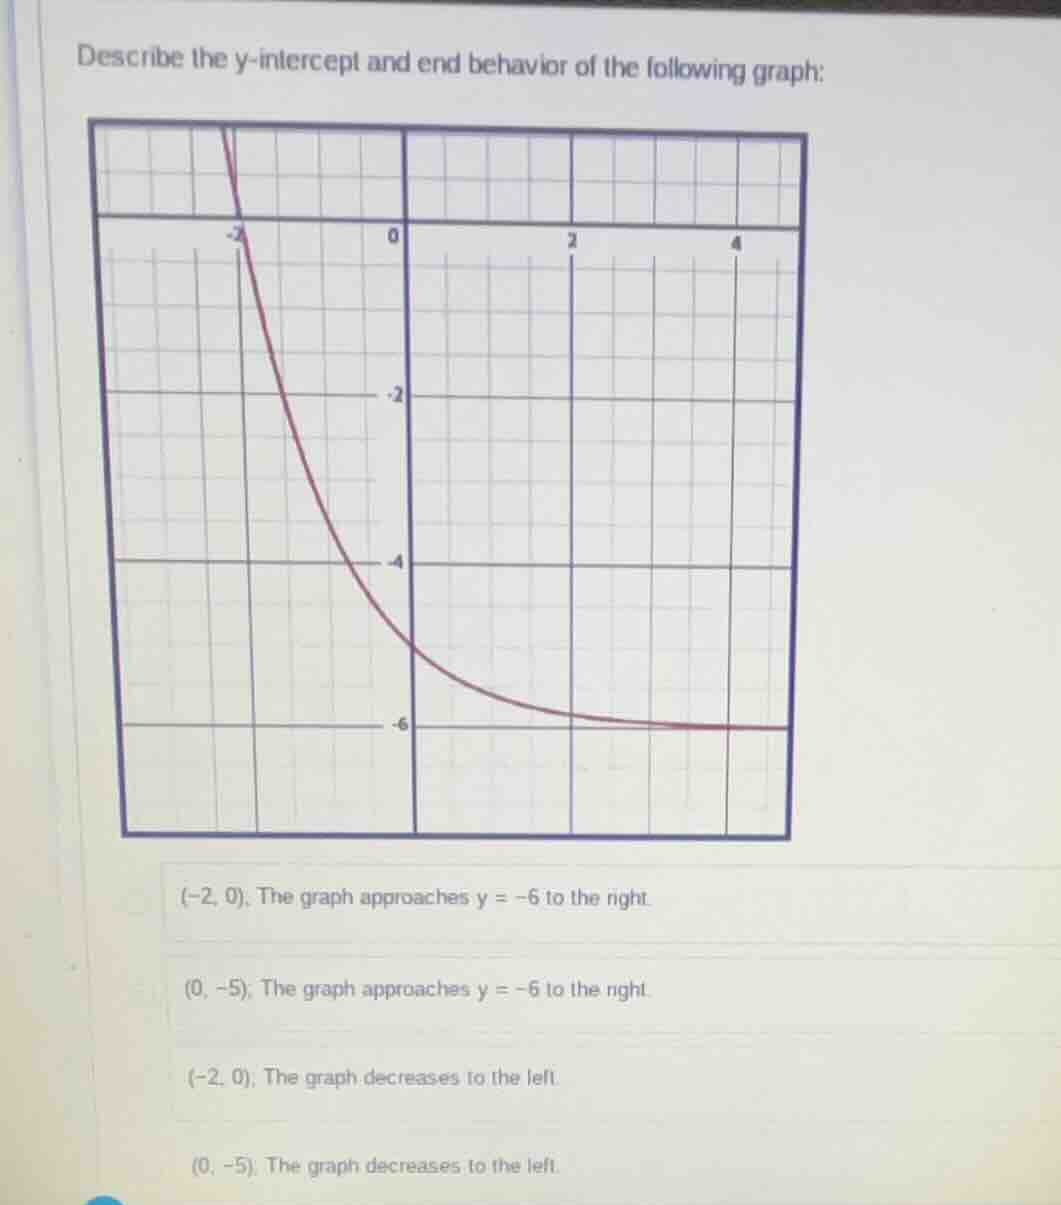
describe the y-intercept and end behavior of the following graph:
(-2, 0). the graph approaches y = -6 to the right.
(0, -5). the graph approaches y = -6 to the right.
(-2, 0). the graph decreases to the left.
(0, -5). the graph decreases to the left.
Brief Explanations
- Y-intercept: The y-intercept is the point where the graph crosses the y-axis (where $x=0$). From the graph, this point is $(0, -5)$.
- End Behavior:
- As $x$ increases (moves to the right), the graph gets closer and closer to the horizontal line $y=-6$ without crossing it, so it approaches $y=-6$.
- As $x$ decreases (moves to the left), the graph moves upward (increases) without bound, so it does not decrease to the left.

Snap & solve any problem in the app
Get step-by-step solutions on Sovi AI
Photo-based solutions with guided steps
Explore more problems and detailed explanations
(0, -5). The graph approaches y = -6 to the right.