QUESTION IMAGE
Question
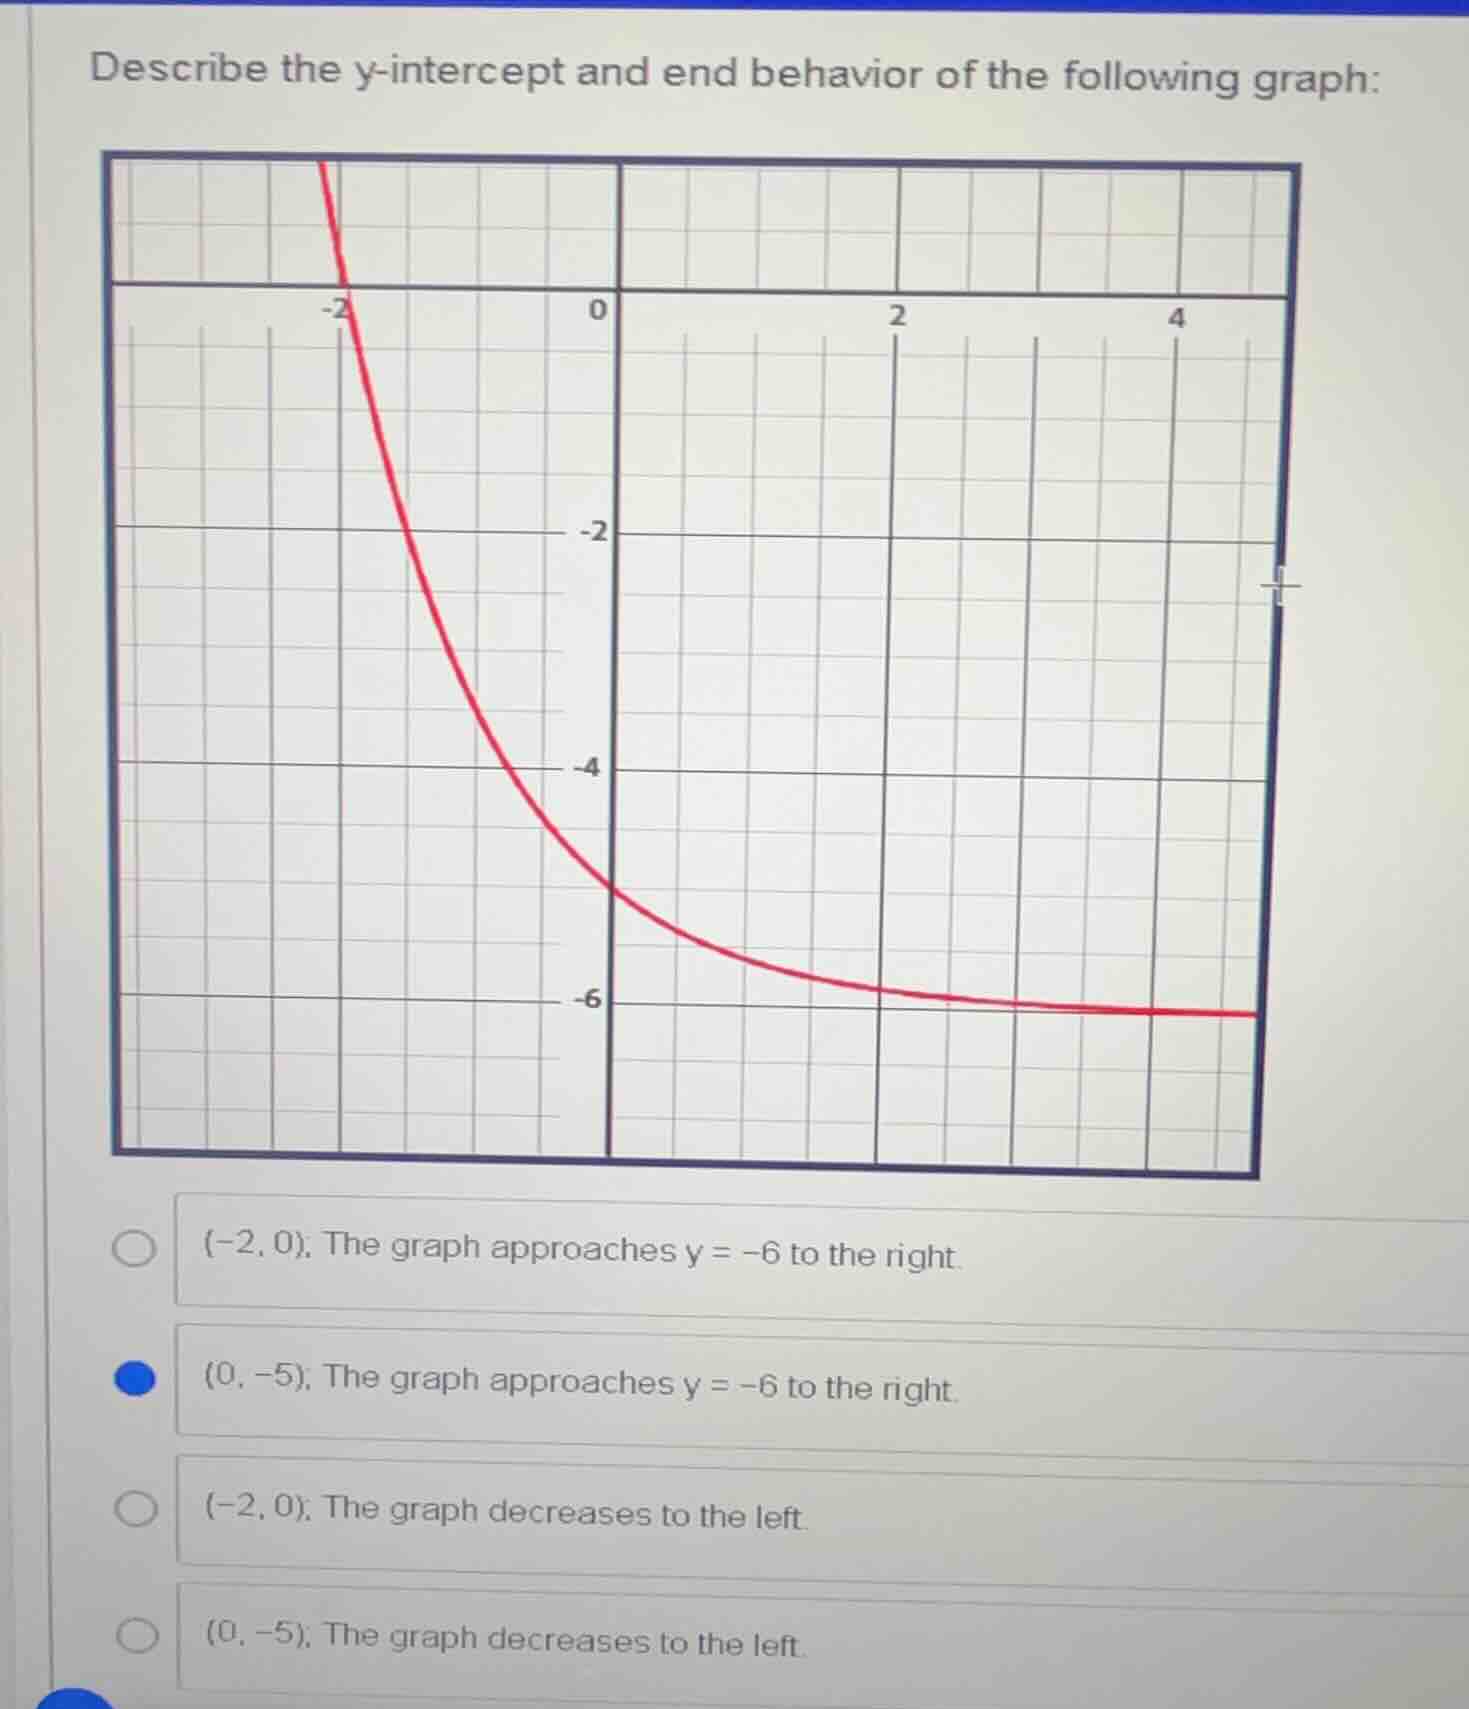
describe the y-intercept and end behavior of the following graph:
(graph: a red curve on a grid, with x-axis from -2 to 4 and y-axis from -6 to 0. the curve passes through (0, -5) and approaches y = -6 to the right. below the graph are four multiple-choice options:
- (-2, 0); the graph approaches y = -6 to the right.
- (0, -5); the graph approaches y = -6 to the right.
- (-2, 0); the graph decreases to the left.
- (0, -5); the graph decreases to the left.)
Brief Explanations
- The y-intercept is the point where the graph crosses the y-axis (x=0). From the graph, this point is (0, -5).
- End behavior describes the graph's trend as x approaches positive infinity (right) or negative infinity (left). As x moves to the right, the graph gets closer to the horizontal line y=-6 without crossing it. As x moves to the left, the graph increases (moves upward), not decreases.

Snap & solve any problem in the app
Get step-by-step solutions on Sovi AI
Photo-based solutions with guided steps
Explore more problems and detailed explanations
B. (0, -5); The graph approaches y = -6 to the right.