QUESTION IMAGE
Question
descriptive statistics
part 2 of 2 1 2 trying to re - learn:
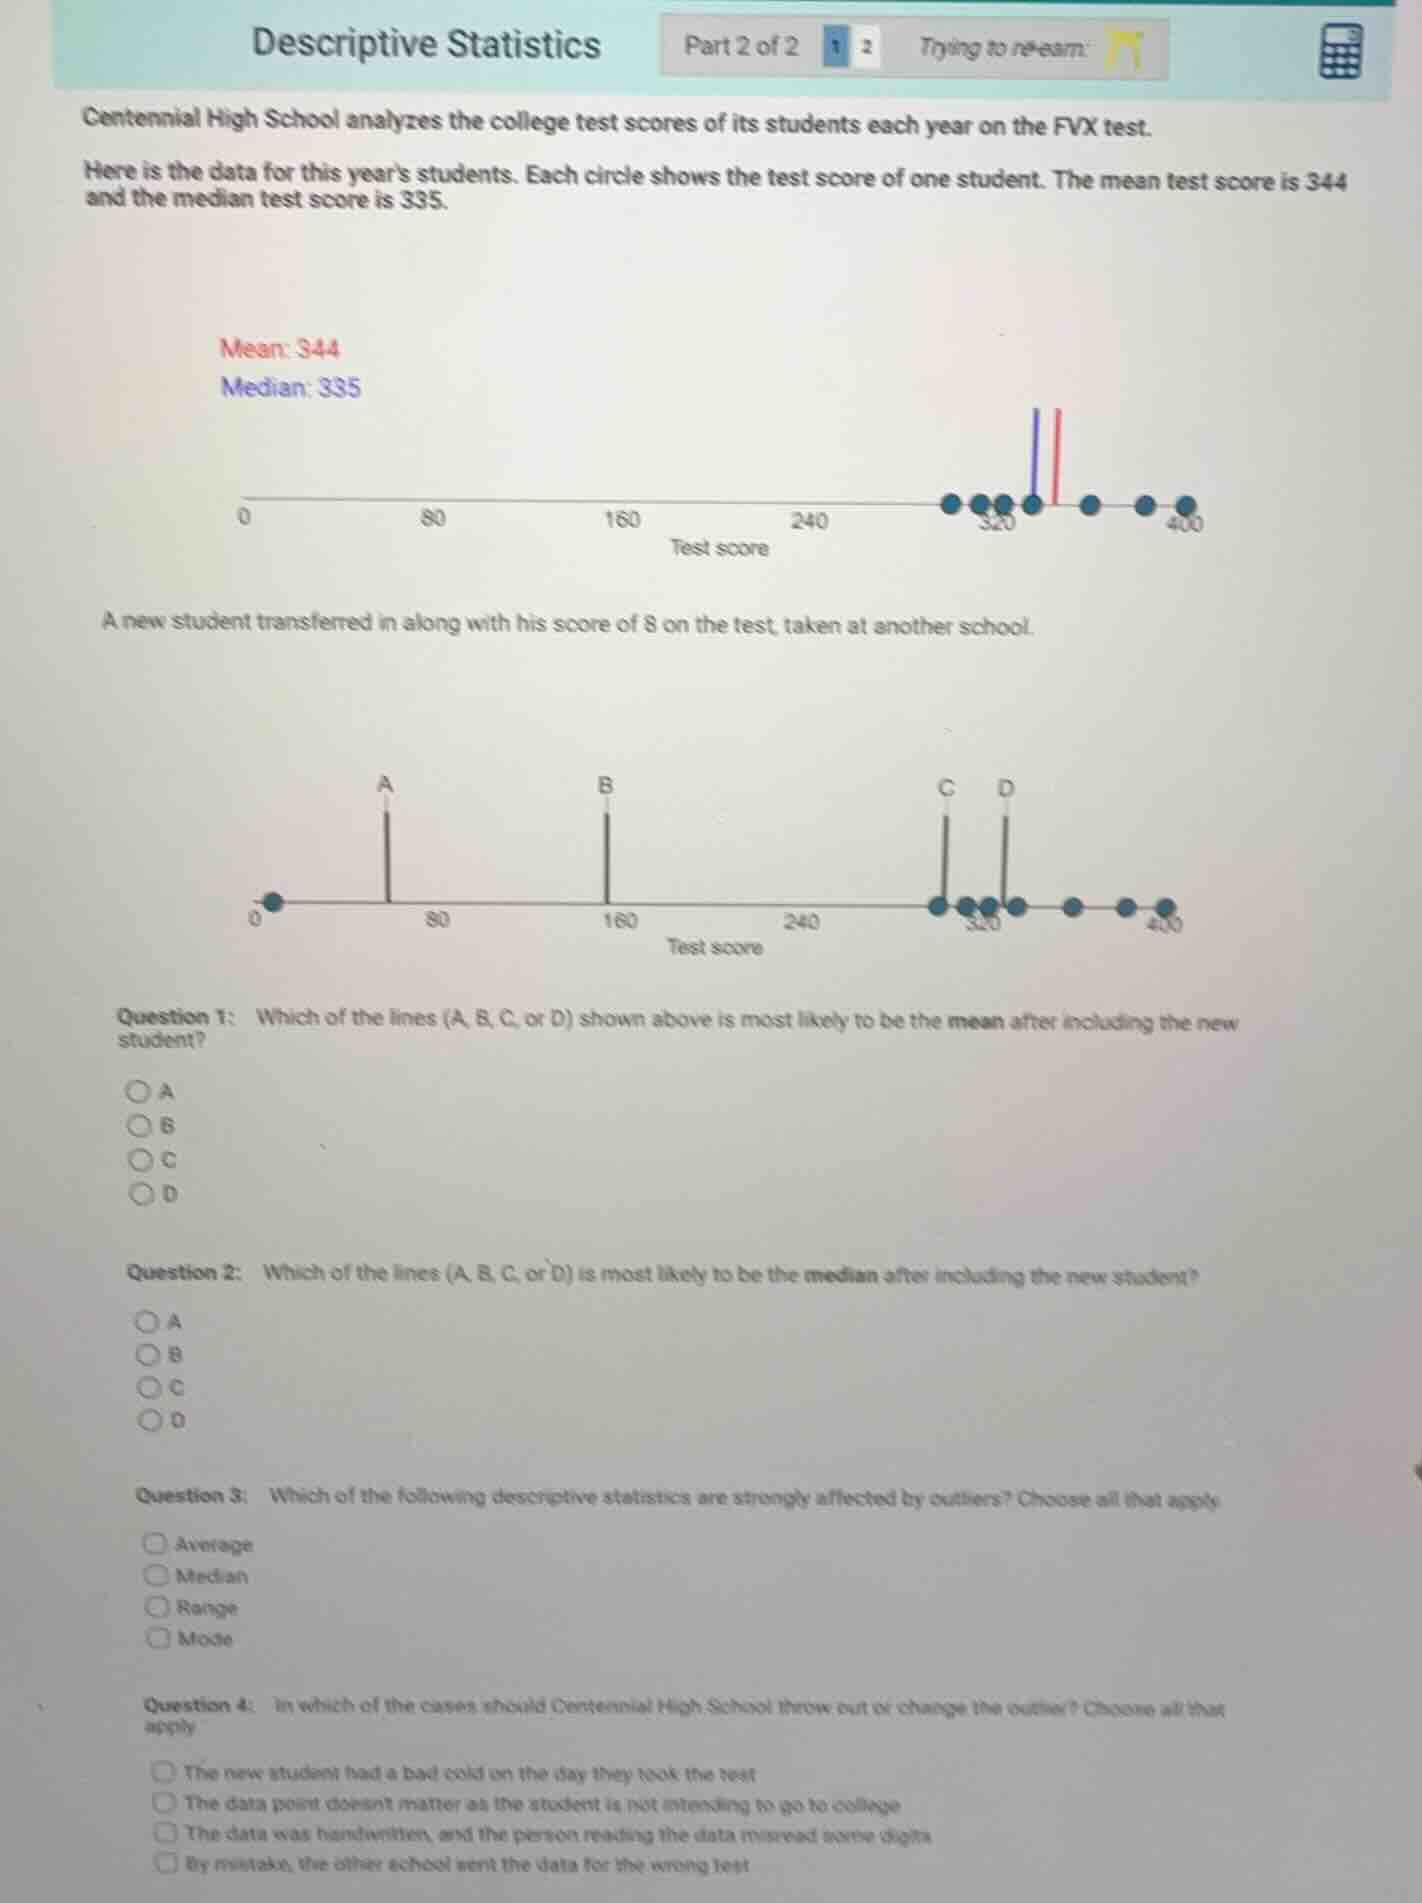
centennial high school analyzes the college test scores of its students each year on the fvx test.
here is the data for this years students. each circle shows the test score of one student. the mean test score is 344 and the median test score is 335.
mean: 344
median: 335
0 80 160 240 400
test score
a new student transferred in along with his score of 8 on the test, taken at another school.
a b c d
0 80 160 240 400
test score
question 1: which of the lines (a, b, c, or d) shown above is most likely to be the mean after including the new student?
a
b
c
d
question 2: which of the lines (a, b, c, or d) is most likely to be the median after including the new student?
a
b
c
d
question 3: which of the following descriptive statistics are strongly affected by outliers? choose all that apply
average
median
range
mode
question 4: in which of the cases should centennial high school throw out or change the outlier? choose all that apply
the new student had a bad cold on the day they took the test
the data point doesnt matter as the student is not intending to go to college
the data was handwritten, and the person reading the data misread some digits
by mistake, the other school sent the data for the wrong test
Step1: Analyze mean's sensitivity to outliers
The mean is strongly affected by extreme low/high values. The original mean is 344, and adding a score of 8 (a very low outlier) will pull the mean downward significantly, so it will be much lower than the original mean, matching line A.
Step2: Analyze median's resistance to outliers
The median is resistant to outliers. First, count original data points: there are 7 points (from the first dot plot). The original median is the 4th value (335). Adding 1 new point makes 8 total points, so the new median is the average of the 4th and 5th values. Both of these are still in the cluster around 320-400, so the median will stay close to the original median, matching line D.
Step3: Identify stats affected by outliers
- Average (mean): Depends on all values, so pulled by outliers.
- Median: Based on middle position, not affected.
- Range: Calculated as max - min; the outlier lowers the min, drastically increasing the range.
- Mode: Most frequent value, unchanged by outliers.
Step4: Determine valid outlier exclusion cases
Outliers should only be removed if the data is erroneous or not representative of the intended dataset:
- A bad cold does not invalidate the student's actual performance on the test.
- The student's college plans do not affect the validity of their test score for the dataset.
- Misread handwritten data means the score is incorrect.
- Receiving data for the wrong test means the score does not belong to this dataset.

Snap & solve any problem in the app
Get step-by-step solutions on Sovi AI
Photo-based solutions with guided steps
Explore more problems and detailed explanations
Question 1: A. Line A
Question 2: D. Line D
Question 3: Average, Range
Question 4: The data was handwritten, and the person reading the data misread some digits; By mistake, the other school sent the data for the wrong test