QUESTION IMAGE
Question
details
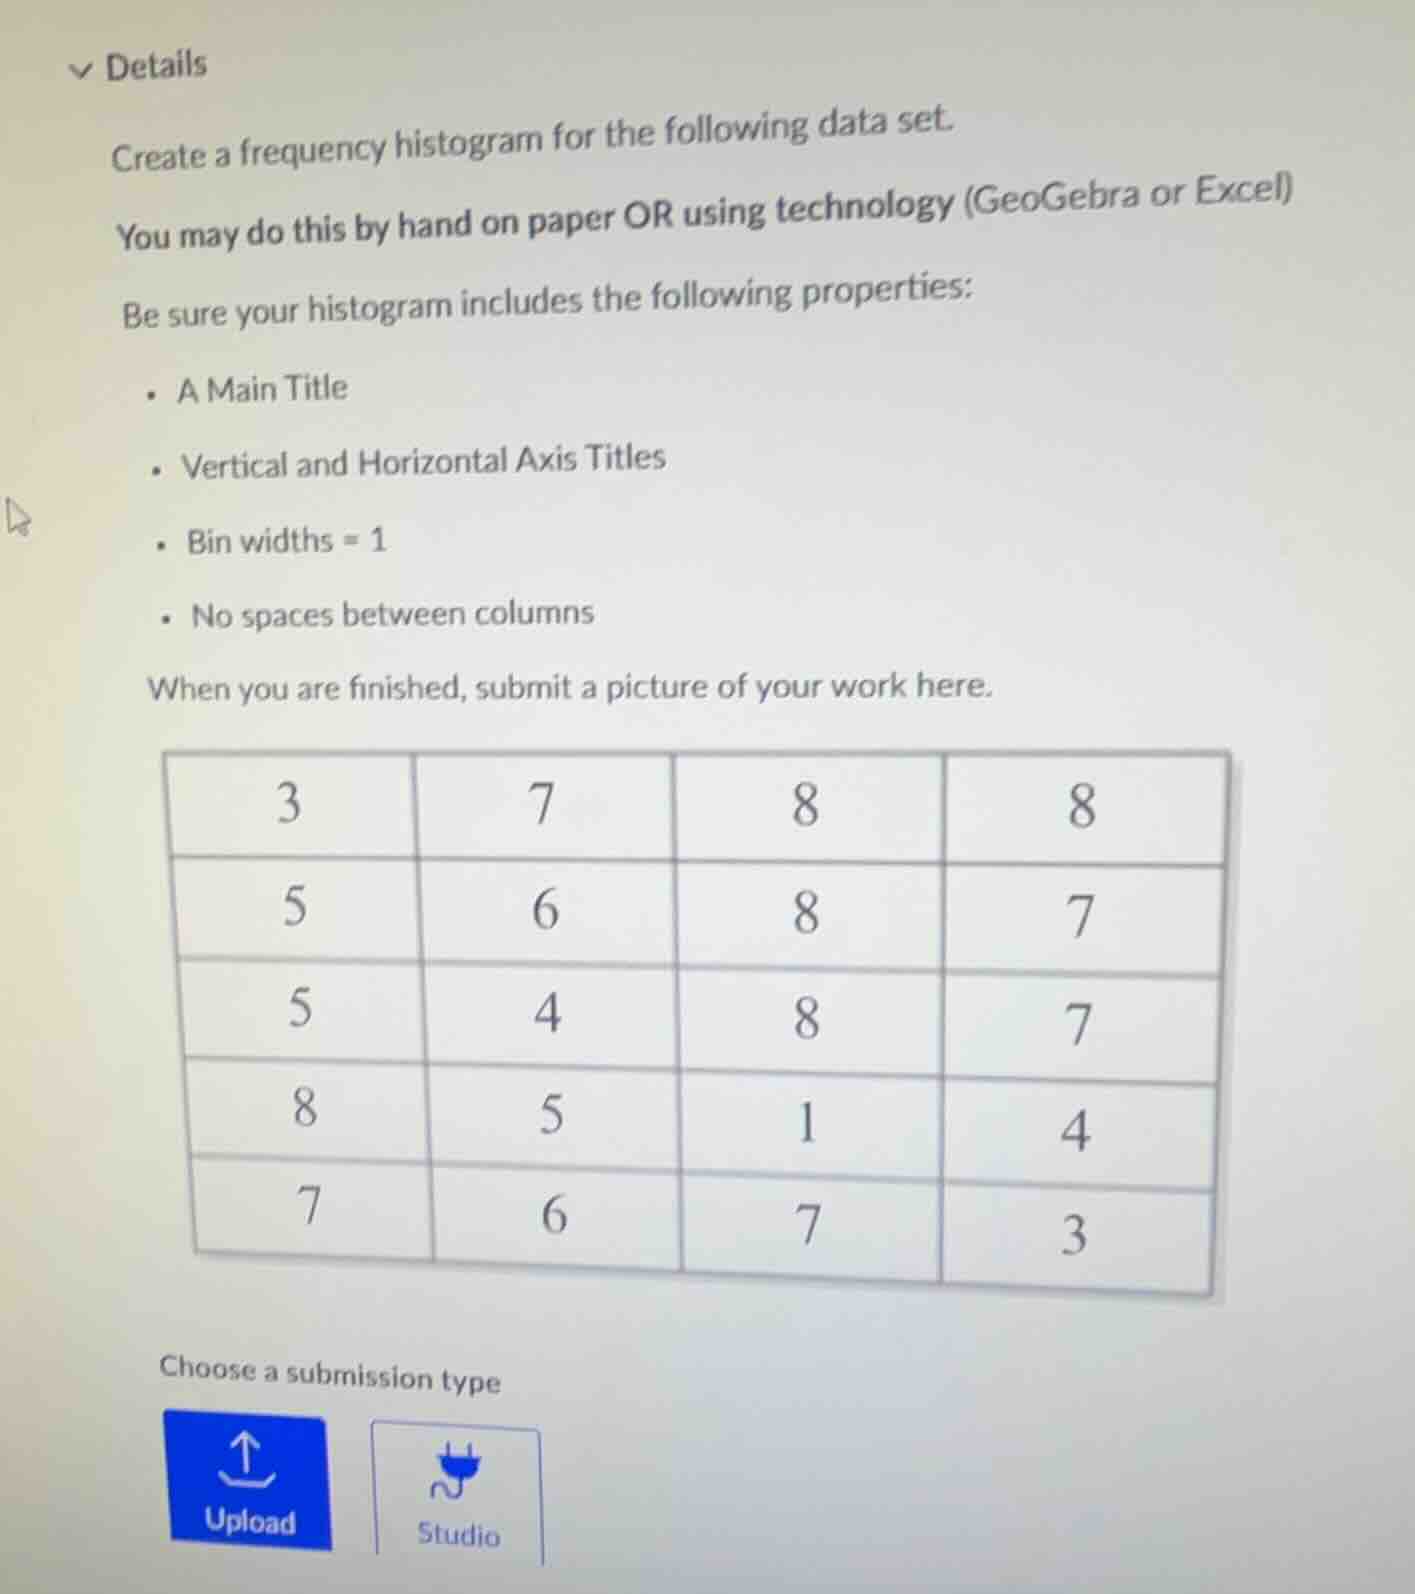
create a frequency histogram for the following data set.
you may do this by hand on paper or using technology (geogebra or excel)
be sure your histogram includes the following properties:
- a main title
- vertical and horizontal axis titles
- bin widths = 1
- no spaces between columns
when you are finished, submit a picture of your work here.
3 7 8 8
5 6 8 7
5 4 8 7
8 5 1 4
7 6 7 3
choose a submission type
upload studio
Step1: List all data values
Data set: $1, 3, 3, 4, 4, 5, 5, 5, 6, 6, 7, 7, 7, 7, 8, 8, 8, 8, 8$
Step2: Tally frequencies (bin width=1)
| Value | Frequency |
|---|---|
| 2 | 0 |
| 3 | 2 |
| 4 | 2 |
| 5 | 3 |
| 6 | 2 |
| 7 | 4 |
| 8 | 5 |
Step3: Define histogram properties
- Main Title: Frequency of Data Values
- Horizontal Axis Title: Data Values
- Vertical Axis Title: Frequency
- Bin width = 1, no gaps between bars

Snap & solve any problem in the app
Get step-by-step solutions on Sovi AI
Photo-based solutions with guided steps
Explore more problems and detailed explanations
A histogram with the following specifications:
- Main Title: Frequency of Data Values
- Horizontal Axis: Labeled "Data Values", marked with integers 1 through 8 (each bin is a single integer, width=1)
- Vertical Axis: Labeled "Frequency", marked with integers 0 through 5
- Bars (no spaces between them):
- Bar for 1: Height = 1
- Bar for 2: Height = 0 (no visible bar)
- Bar for 3: Height = 2
- Bar for 4: Height = 2
- Bar for 5: Height = 3
- Bar for 6: Height = 2
- Bar for 7: Height = 4
- Bar for 8: Height = 5