QUESTION IMAGE
Question
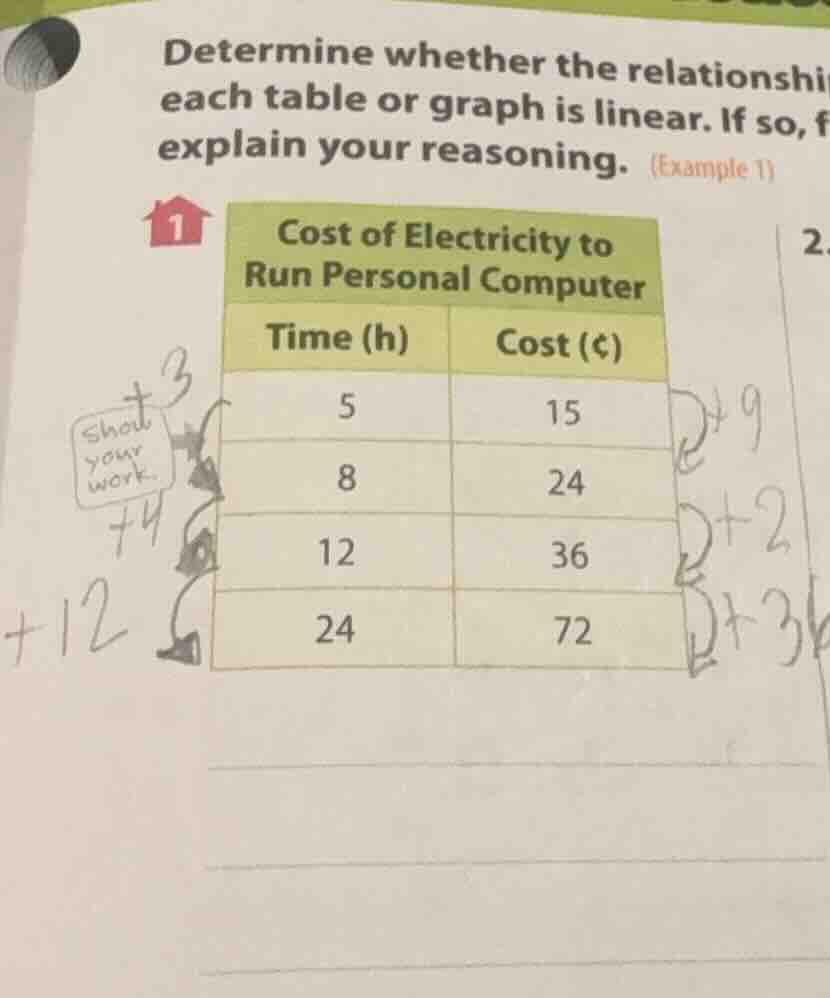
determine whether the relationship each table or graph is linear. if so, explain your reasoning. (example 1)
1
cost of electricity to run personal computer
time (h) | cost (¢)
5 | 15
8 | 24
12 | 36
24 | 72
Step1: Calculate the rate of change (slope) between consecutive points.
For the first two points \((5, 15)\) and \((8, 24)\):
The slope \(m = \frac{y_2 - y_1}{x_2 - x_1}=\frac{24 - 15}{8 - 5}=\frac{9}{3} = 3\).
Step2: Check the slope between the next two points \((8, 24)\) and \((12, 36)\):
\(m=\frac{36 - 24}{12 - 8}=\frac{12}{4}=3\).
Step3: Check the slope between \((12, 36)\) and \((24, 72)\):
\(m=\frac{72 - 36}{24 - 12}=\frac{36}{12}=3\).
Since the rate of change (slope) is constant (\(m = 3\)) for all consecutive pairs of points, the relationship is linear. The equation of the line can be found using the point - slope form \(y - y_1=m(x - x_1)\). Using the point \((5,15)\) and \(m = 3\), we get \(y-15 = 3(x - 5)\), which simplifies to \(y=3x\) (where \(x\) is time in hours and \(y\) is cost in cents).

Snap & solve any problem in the app
Get step-by-step solutions on Sovi AI
Photo-based solutions with guided steps
Explore more problems and detailed explanations
The relationship is linear because the rate of change (slope) between any two points in the table is constant (equal to 3). The equation representing the relationship is \(y = 3x\) (where \(x\) is the time in hours and \(y\) is the cost in cents).