QUESTION IMAGE
Question
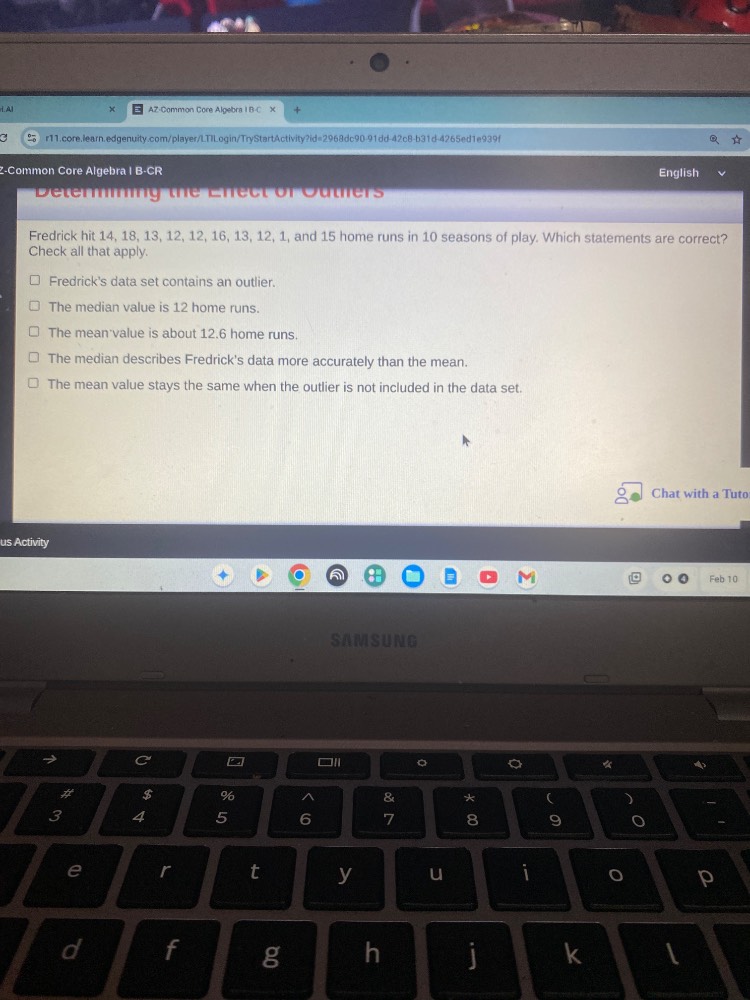
determining the effect of outliers
fredrick hit 14, 18, 13, 12, 12, 16, 13, 12, 1, and 15 home runs in 10 seasons of play. which statements are correct?
check all that apply.
□ fredricks data set contains an outlier.
□ the median value is 12 home runs.
□ the mean value is about 12.6 home runs.
□ the median describes fredricks data more accurately than the mean.
□ the mean value stays the same when the outlier is not included in the data set.
Step1: Order the data set
12, 12, 12, 13, 13, 14, 15, 16, 18, 19
Step2: Check for outliers
IQR = Q3 - Q1 = 16 - 12 = 4; Lower bound: $12 - 1.5\times4=6$, Upper bound: $16 + 1.5\times4=22$. All values are within bounds, no outliers.
Step3: Calculate the median
Even number of values: $\frac{13+14}{2}=13.5$
Step4: Calculate the mean
$\frac{12+12+12+13+13+14+15+16+18+19}{10}=\frac{126}{10}=12.6$
Step5: Compare median vs mean
Since there are no outliers, both describe the data, but the mean is 12.6, median 13.5. Without outliers (none exist), mean stays same.

Snap & solve any problem in the app
Get step-by-step solutions on Sovi AI
Photo-based solutions with guided steps
Explore more problems and detailed explanations
- The mean value is about 12.6 home runs.