QUESTION IMAGE
Question
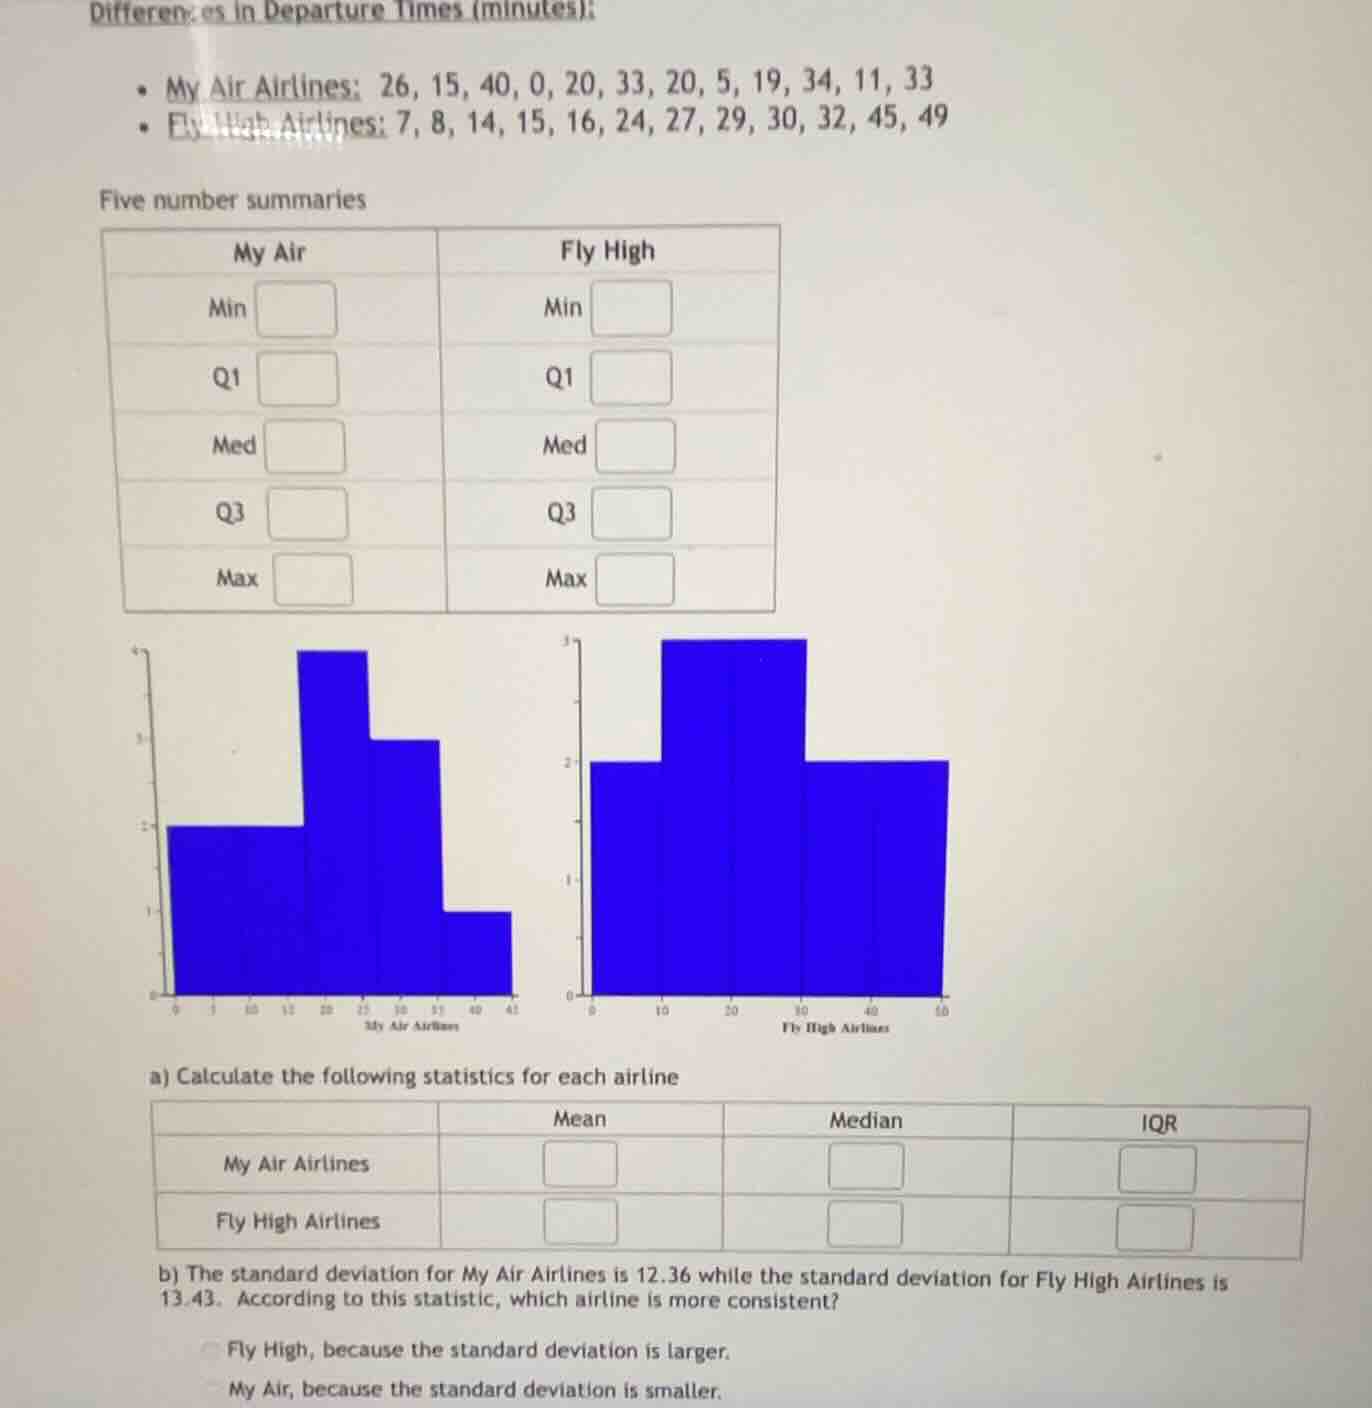
differences in departure times (minutes):
- my air airlines: 26, 15, 40, 0, 20, 33, 20, 5, 19, 34, 11, 33
- fly high airlines: 7, 8, 14, 15, 16, 24, 27, 29, 30, 32, 45, 49
five number summaries
| my air | fly high |
|---|---|
| q1 | q1 |
| med | med |
| q3 | q3 |
| max | max |
a) calculate the following statistics for each airline
| mean | median | iqr | |
|---|---|---|---|
| fly high airlines |
b) the standard deviation for my air airlines is 12.36 while the standard deviation for fly high airlines is 13.43. according to this statistic, which airline is more consistent?
- fly high, because the standard deviation is larger.
- my air, because the standard deviation is smaller.
Part a) My Air Airlines
Step 1: Sort the data
The data for My Air Airlines is: \( 26, 15, 40, 0, 20, 33, 20, 5, 19, 34, 11, 33 \). Sorting it in ascending order: \( 0, 5, 11, 15, 19, 20, 20, 26, 33, 33, 34, 40 \)
Step 2: Calculate the Mean
The mean (\(\bar{x}\)) is calculated as \(\bar{x}=\frac{\sum_{i = 1}^{n}x_{i}}{n}\), where \(n = 12\) (number of data points) and \(\sum_{i=1}^{12}x_{i}=0 + 5+11 + 15+19+20+20+26+33+33+34+40=256\)
\(\bar{x}=\frac{256}{12}\approx21.33\)
Step 3: Calculate the Median
Since \(n = 12\) (even), the median is the average of the \(\frac{n}{2}\)-th and \((\frac{n}{2}+ 1)\)-th values. \(\frac{n}{2}=6\) and \(\frac{n}{2}+1 = 7\). The 6th value is \(20\) and the 7th value is \(20\). Median \(=\frac{20 + 20}{2}=20\)
Step 4: Calculate Q1 and Q3
- The first quartile (Q1) is the median of the lower half of the data. The lower half (first 6 values): \(0, 5, 11, 15, 19, 20\). The median of this set (since \(n = 6\) even) is \(\frac{11+15}{2}=13\)
- The third quartile (Q3) is the median of the upper half of the data. The upper half (last 6 values): \(20, 26, 33, 33, 34, 40\). The median of this set (since \(n = 6\) even) is \(\frac{33+33}{2}=33\)
- IQR (Inter - Quartile Range) \(=Q3 - Q1=33-13 = 20\)
Part a) Fly High Airlines
Step 1: Sort the data
The data for Fly High Airlines is: \(7, 8, 14, 15, 16, 24, 27, 29, 30, 32, 45, 49\). Sorting it in ascending order: \(7, 8, 14, 15, 16, 24, 27, 29, 30, 32, 45, 49\)
Step 2: Calculate the Mean
The mean (\(\bar{x}\)) is calculated as \(\bar{x}=\frac{\sum_{i = 1}^{n}x_{i}}{n}\), where \(n = 12\) and \(\sum_{i = 1}^{12}x_{i}=7 + 8+14+15+16+24+27+29+30+32+45+49 = 296\)
\(\bar{x}=\frac{296}{12}\approx24.67\)
Step 3: Calculate the Median
Since \(n = 12\) (even), the median is the average of the \(\frac{n}{2}\)-th and \((\frac{n}{2}+1)\)-th values. \(\frac{n}{2}=6\) and \(\frac{n}{2}+1=7\). The 6th value is \(24\) and the 7th value is \(27\). Median \(=\frac{24 + 27}{2}=25.5\)
Step 4: Calculate Q1 and Q3
- The first quartile (Q1) is the median of the lower half of the data. The lower half (first 6 values): \(7, 8, 14, 15, 16, 24\). The median of this set (since \(n = 6\) even) is \(\frac{14 + 15}{2}=14.5\)
- The third quartile (Q3) is the median of the upper half of the data. The upper half (last 6 values): \(27, 29, 30, 32, 45, 49\). The median of this set (since \(n = 6\) even) is \(\frac{30+32}{2}=31\)
- IQR (Inter - Quartile Range) \(=Q3 - Q1=31 - 14.5=16.5\)
Part b)
Standard deviation measures the spread of data. A smaller standard deviation means that the data points are closer to the mean, i.e., more consistent. The standard deviation of My Air Airlines (\(12.36\)) is smaller than that of Fly High Airlines (\(13.43\)). So My Air Airlines is more consistent.
Final Answers for Part a)
| Mean | Median | IQR | |
|---|---|---|---|
| Fly High Airlines | \(\approx24.67\) | \(25.5\) | \(16.5\) |
Final Answer for Part b)
My Air, because the standard deviation is smaller.

Snap & solve any problem in the app
Get step-by-step solutions on Sovi AI
Photo-based solutions with guided steps
Explore more problems and detailed explanations
Part a) My Air Airlines
Step 1: Sort the data
The data for My Air Airlines is: \( 26, 15, 40, 0, 20, 33, 20, 5, 19, 34, 11, 33 \). Sorting it in ascending order: \( 0, 5, 11, 15, 19, 20, 20, 26, 33, 33, 34, 40 \)
Step 2: Calculate the Mean
The mean (\(\bar{x}\)) is calculated as \(\bar{x}=\frac{\sum_{i = 1}^{n}x_{i}}{n}\), where \(n = 12\) (number of data points) and \(\sum_{i=1}^{12}x_{i}=0 + 5+11 + 15+19+20+20+26+33+33+34+40=256\)
\(\bar{x}=\frac{256}{12}\approx21.33\)
Step 3: Calculate the Median
Since \(n = 12\) (even), the median is the average of the \(\frac{n}{2}\)-th and \((\frac{n}{2}+ 1)\)-th values. \(\frac{n}{2}=6\) and \(\frac{n}{2}+1 = 7\). The 6th value is \(20\) and the 7th value is \(20\). Median \(=\frac{20 + 20}{2}=20\)
Step 4: Calculate Q1 and Q3
- The first quartile (Q1) is the median of the lower half of the data. The lower half (first 6 values): \(0, 5, 11, 15, 19, 20\). The median of this set (since \(n = 6\) even) is \(\frac{11+15}{2}=13\)
- The third quartile (Q3) is the median of the upper half of the data. The upper half (last 6 values): \(20, 26, 33, 33, 34, 40\). The median of this set (since \(n = 6\) even) is \(\frac{33+33}{2}=33\)
- IQR (Inter - Quartile Range) \(=Q3 - Q1=33-13 = 20\)
Part a) Fly High Airlines
Step 1: Sort the data
The data for Fly High Airlines is: \(7, 8, 14, 15, 16, 24, 27, 29, 30, 32, 45, 49\). Sorting it in ascending order: \(7, 8, 14, 15, 16, 24, 27, 29, 30, 32, 45, 49\)
Step 2: Calculate the Mean
The mean (\(\bar{x}\)) is calculated as \(\bar{x}=\frac{\sum_{i = 1}^{n}x_{i}}{n}\), where \(n = 12\) and \(\sum_{i = 1}^{12}x_{i}=7 + 8+14+15+16+24+27+29+30+32+45+49 = 296\)
\(\bar{x}=\frac{296}{12}\approx24.67\)
Step 3: Calculate the Median
Since \(n = 12\) (even), the median is the average of the \(\frac{n}{2}\)-th and \((\frac{n}{2}+1)\)-th values. \(\frac{n}{2}=6\) and \(\frac{n}{2}+1=7\). The 6th value is \(24\) and the 7th value is \(27\). Median \(=\frac{24 + 27}{2}=25.5\)
Step 4: Calculate Q1 and Q3
- The first quartile (Q1) is the median of the lower half of the data. The lower half (first 6 values): \(7, 8, 14, 15, 16, 24\). The median of this set (since \(n = 6\) even) is \(\frac{14 + 15}{2}=14.5\)
- The third quartile (Q3) is the median of the upper half of the data. The upper half (last 6 values): \(27, 29, 30, 32, 45, 49\). The median of this set (since \(n = 6\) even) is \(\frac{30+32}{2}=31\)
- IQR (Inter - Quartile Range) \(=Q3 - Q1=31 - 14.5=16.5\)
Part b)
Standard deviation measures the spread of data. A smaller standard deviation means that the data points are closer to the mean, i.e., more consistent. The standard deviation of My Air Airlines (\(12.36\)) is smaller than that of Fly High Airlines (\(13.43\)). So My Air Airlines is more consistent.
Final Answers for Part a)
| Mean | Median | IQR | |
|---|---|---|---|
| Fly High Airlines | \(\approx24.67\) | \(25.5\) | \(16.5\) |
Final Answer for Part b)
My Air, because the standard deviation is smaller.