QUESTION IMAGE
Question
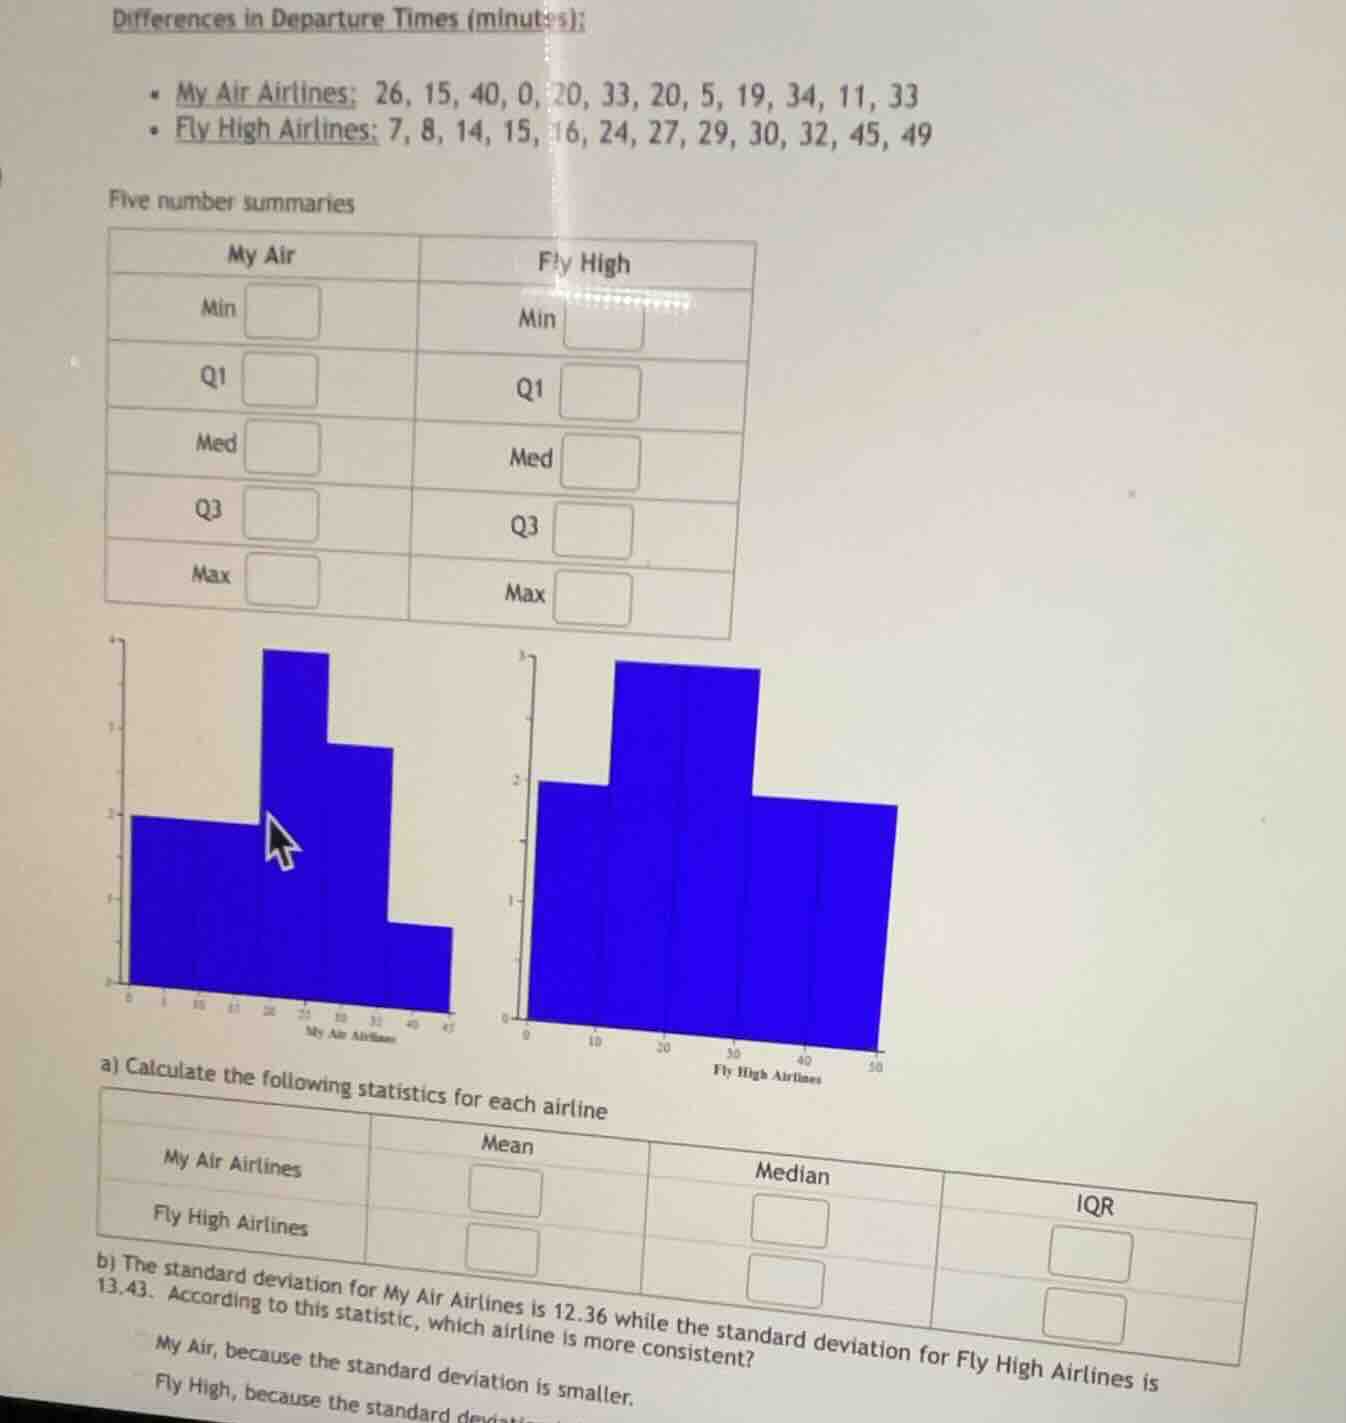
differences in departure times (minutes):
- my air airlines: 26, 15, 40, 0, 20, 33, 20, 5, 19, 34, 11, 33
- fly high airlines: 7, 8, 14, 15, 16, 24, 27, 29, 30, 32, 45, 49
five number summaries
| my air | fly high | ||
|---|---|---|---|
| q1 | q1 | ||
| med | med | ||
| q3 | q3 | ||
| max | max |
(histograms for my air airlines and fly high airlines are shown)
a) calculate the following statistics for each airline
| mean | median | iqr | |
|---|---|---|---|
| fly high airlines |
b) the standard deviation for my air airlines is 12.36 while the standard deviation for fly high airlines is 13.43. according to this statistic, which airline is more consistent?
my air, because the standard deviation is smaller.
fly high, because the standard deviation...
Part a) My Air Airlines
Mean
Step1: Sum the data
Data: \( 26, 15, 40, 0, 20, 33, 20, 5, 19, 34, 11, 33 \)
Sum \( = 26 + 15 + 40 + 0 + 20 + 33 + 20 + 5 + 19 + 34 + 11 + 33 \)
\( = 256 \)
Step2: Divide by number of data points (12)
Mean \( = \frac{256}{12} \approx 21.33 \)
Median
Step1: Order the data
Ordered: \( 0, 5, 11, 15, 19, 20, 20, 26, 33, 33, 34, 40 \)
Step2: Find the middle (average of 6th and 7th terms)
6th term: \( 20 \), 7th term: \( 20 \)
Median \( = \frac{20 + 20}{2} = 20 \)
IQR (Interquartile Range)
Step1: Find Q1 (median of lower half)
Lower half: \( 0, 5, 11, 15, 19, 20 \) (first 6 terms)
Median of lower half: \( \frac{11 + 15}{2} = 13 \) (Q1)
Step2: Find Q3 (median of upper half)
Upper half: \( 26, 33, 33, 34, 40 \) (wait, correction: upper half is \( 20, 26, 33, 33, 34, 40 \) (last 6 terms))
Median of upper half: \( \frac{33 + 33}{2} = 33 \) (Q3)
Step3: Calculate IQR = Q3 - Q1
IQR \( = 33 - 13 = 20 \)
Part a) Fly High Airlines
Mean
Step1: Sum the data
Data: \( 7, 8, 14, 15, 16, 24, 27, 29, 30, 32, 45, 49 \)
Sum \( = 7 + 8 + 14 + 15 + 16 + 24 + 27 + 29 + 30 + 32 + 45 + 49 \)
\( = 296 \)
Step2: Divide by 12
Mean \( = \frac{296}{12} \approx 24.67 \)
Median
Step1: Order the data
Ordered: \( 7, 8, 14, 15, 16, 24, 27, 29, 30, 32, 45, 49 \)
Step2: Average of 6th and 7th terms
6th term: \( 24 \), 7th term: \( 27 \)
Median \( = \frac{24 + 27}{2} = 25.5 \)
IQR
Step1: Find Q1 (median of lower half)
Lower half: \( 7, 8, 14, 15, 16, 24 \)
Median of lower half: \( \frac{14 + 15}{2} = 14.5 \) (Q1)
Step2: Find Q3 (median of upper half)
Upper half: \( 27, 29, 30, 32, 45, 49 \)
Median of upper half: \( \frac{30 + 32}{2} = 31 \) (Q3)
Step3: Calculate IQR = Q3 - Q1
IQR \( = 31 - 14.5 = 16.5 \)
Part b) Consistency (Standard Deviation)
Standard deviation measures spread; smaller = more consistent.
My Air: \( 12.36 \), Fly High: \( 13.43 \)
Since \( 12.36 < 13.43 \), My Air is more consistent.
Final Answers (a)
- My Air Airlines:
Mean: \( \approx 21.33 \)
Median: \( 20 \)
IQR: \( 20 \)
- Fly High Airlines:
Mean: \( \approx 24.67 \)
Median: \( 25.5 \)
IQR: \( 16.5 \)
Final Answer (b)
My Air, because the standard deviation is smaller.

Snap & solve any problem in the app
Get step-by-step solutions on Sovi AI
Photo-based solutions with guided steps
Explore more problems and detailed explanations
Part a) My Air Airlines
Mean
Step1: Sum the data
Data: \( 26, 15, 40, 0, 20, 33, 20, 5, 19, 34, 11, 33 \)
Sum \( = 26 + 15 + 40 + 0 + 20 + 33 + 20 + 5 + 19 + 34 + 11 + 33 \)
\( = 256 \)
Step2: Divide by number of data points (12)
Mean \( = \frac{256}{12} \approx 21.33 \)
Median
Step1: Order the data
Ordered: \( 0, 5, 11, 15, 19, 20, 20, 26, 33, 33, 34, 40 \)
Step2: Find the middle (average of 6th and 7th terms)
6th term: \( 20 \), 7th term: \( 20 \)
Median \( = \frac{20 + 20}{2} = 20 \)
IQR (Interquartile Range)
Step1: Find Q1 (median of lower half)
Lower half: \( 0, 5, 11, 15, 19, 20 \) (first 6 terms)
Median of lower half: \( \frac{11 + 15}{2} = 13 \) (Q1)
Step2: Find Q3 (median of upper half)
Upper half: \( 26, 33, 33, 34, 40 \) (wait, correction: upper half is \( 20, 26, 33, 33, 34, 40 \) (last 6 terms))
Median of upper half: \( \frac{33 + 33}{2} = 33 \) (Q3)
Step3: Calculate IQR = Q3 - Q1
IQR \( = 33 - 13 = 20 \)
Part a) Fly High Airlines
Mean
Step1: Sum the data
Data: \( 7, 8, 14, 15, 16, 24, 27, 29, 30, 32, 45, 49 \)
Sum \( = 7 + 8 + 14 + 15 + 16 + 24 + 27 + 29 + 30 + 32 + 45 + 49 \)
\( = 296 \)
Step2: Divide by 12
Mean \( = \frac{296}{12} \approx 24.67 \)
Median
Step1: Order the data
Ordered: \( 7, 8, 14, 15, 16, 24, 27, 29, 30, 32, 45, 49 \)
Step2: Average of 6th and 7th terms
6th term: \( 24 \), 7th term: \( 27 \)
Median \( = \frac{24 + 27}{2} = 25.5 \)
IQR
Step1: Find Q1 (median of lower half)
Lower half: \( 7, 8, 14, 15, 16, 24 \)
Median of lower half: \( \frac{14 + 15}{2} = 14.5 \) (Q1)
Step2: Find Q3 (median of upper half)
Upper half: \( 27, 29, 30, 32, 45, 49 \)
Median of upper half: \( \frac{30 + 32}{2} = 31 \) (Q3)
Step3: Calculate IQR = Q3 - Q1
IQR \( = 31 - 14.5 = 16.5 \)
Part b) Consistency (Standard Deviation)
Standard deviation measures spread; smaller = more consistent.
My Air: \( 12.36 \), Fly High: \( 13.43 \)
Since \( 12.36 < 13.43 \), My Air is more consistent.
Final Answers (a)
- My Air Airlines:
Mean: \( \approx 21.33 \)
Median: \( 20 \)
IQR: \( 20 \)
- Fly High Airlines:
Mean: \( \approx 24.67 \)
Median: \( 25.5 \)
IQR: \( 16.5 \)
Final Answer (b)
My Air, because the standard deviation is smaller.