QUESTION IMAGE
Question
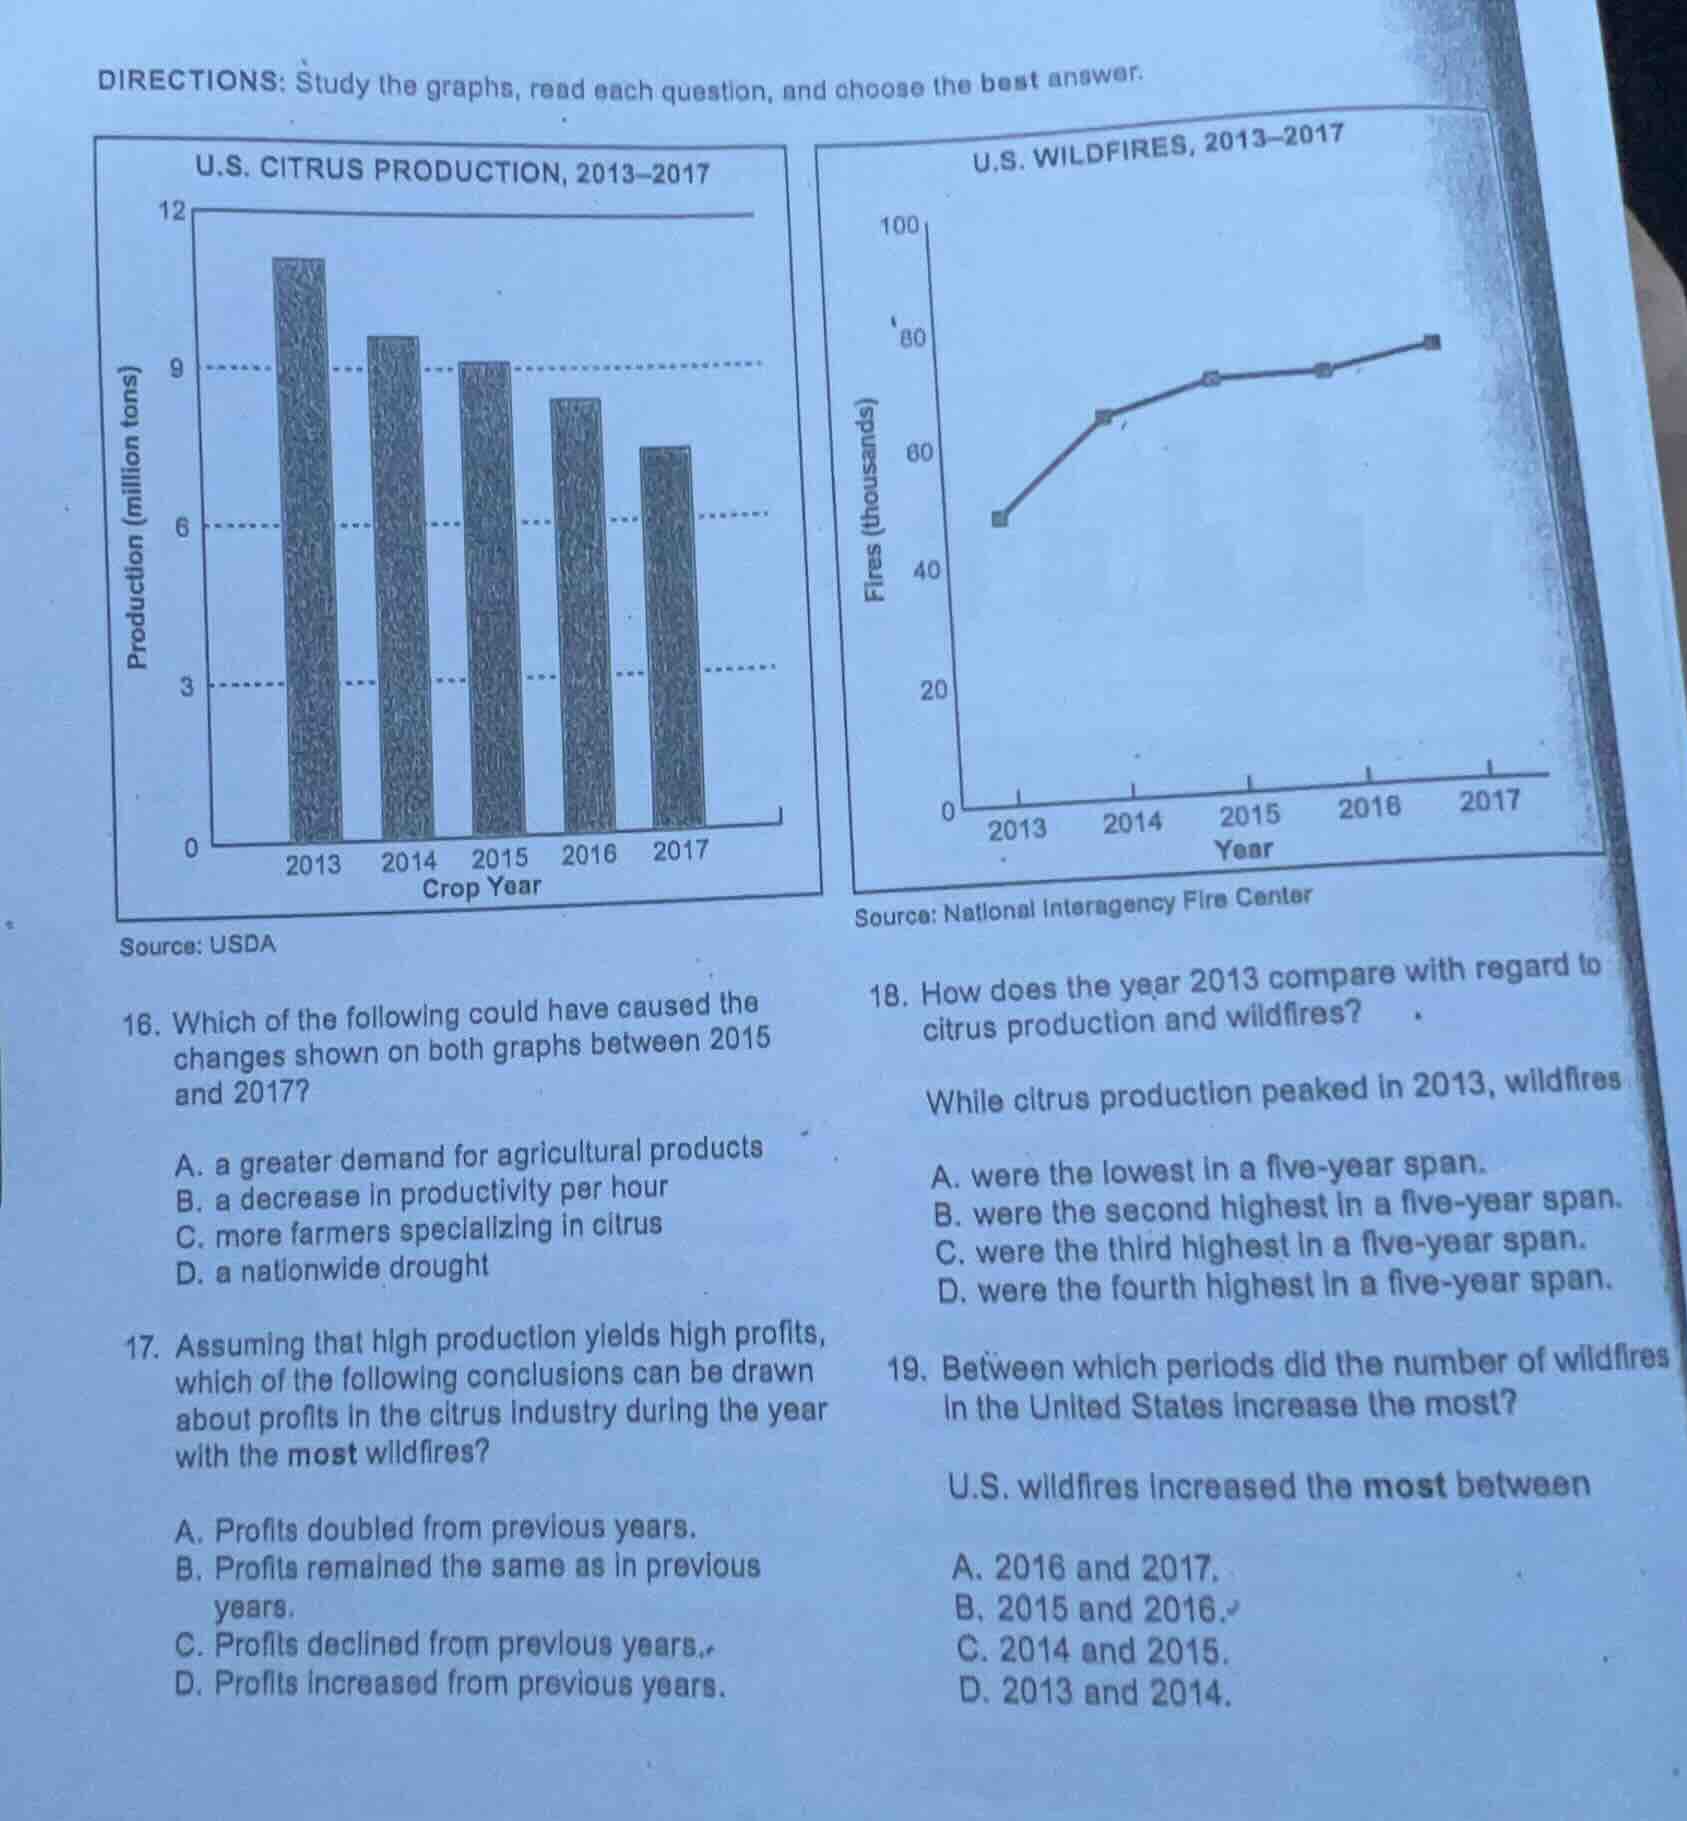
directions: study the graphs, read each question, and choose the best answer.
u.s. citrus production, 2013-2017
source: usda
u.s. wildfires, 2013-2017
source: national interagency fire center
- which of the following could have caused the changes shown on both graphs between 2015 and 2017?
a. a greater demand for agricultural products
b. a decrease in productivity per hour
c. more farmers specializing in citrus
d. a nationwide drought
- assuming that high production yields high profits, which of the following conclusions can be drawn about profits in the citrus industry during the year with the most wildfires?
a. profits doubled from previous years.
b. profits remained the same as in previous years.
c. profits declined from previous years.
d. profits increased from previous years.
- how does the year 2013 compare with regard to citrus production and wildfires?
while citrus production peaked in 2013, wildfires
a. were the lowest in a five-year span.
b. were the second highest in a five-year span.
c. were the third highest in a five-year span.
d. were the fourth highest in a five-year span.
- between which periods did the number of wildfires in the united states increase the most?
u.s. wildfires increased the most between
a. 2016 and 2017.
b. 2015 and 2016.
c. 2014 and 2015.
d. 2013 and 2014.
Step1: Analyze Q16 graph trends
From 2015-2017, citrus production falls, wildfires rise. Drought reduces crop yield and increases wildfire risk.
Step2: Analyze Q17 profit & fire link
Most wildfires are in 2017; citrus production (and thus profit) is lowest that year, so profits declined.
Step3: Analyze Q18 2013 data
2013 citrus production is highest; wildfires are the lowest of the 5 years.
Step4: Analyze Q19 fire growth
Calculate year-over-year fire increases: 2013-2014 has the largest upward jump on the line graph.

Snap & solve any problem in the app
Get step-by-step solutions on Sovi AI
Photo-based solutions with guided steps
Explore more problems and detailed explanations
- D. a nationwide drought
- C. Profits declined from previous years.
- A. were the lowest in a five-year span.
- D. 2013 and 2014.