QUESTION IMAGE
Question
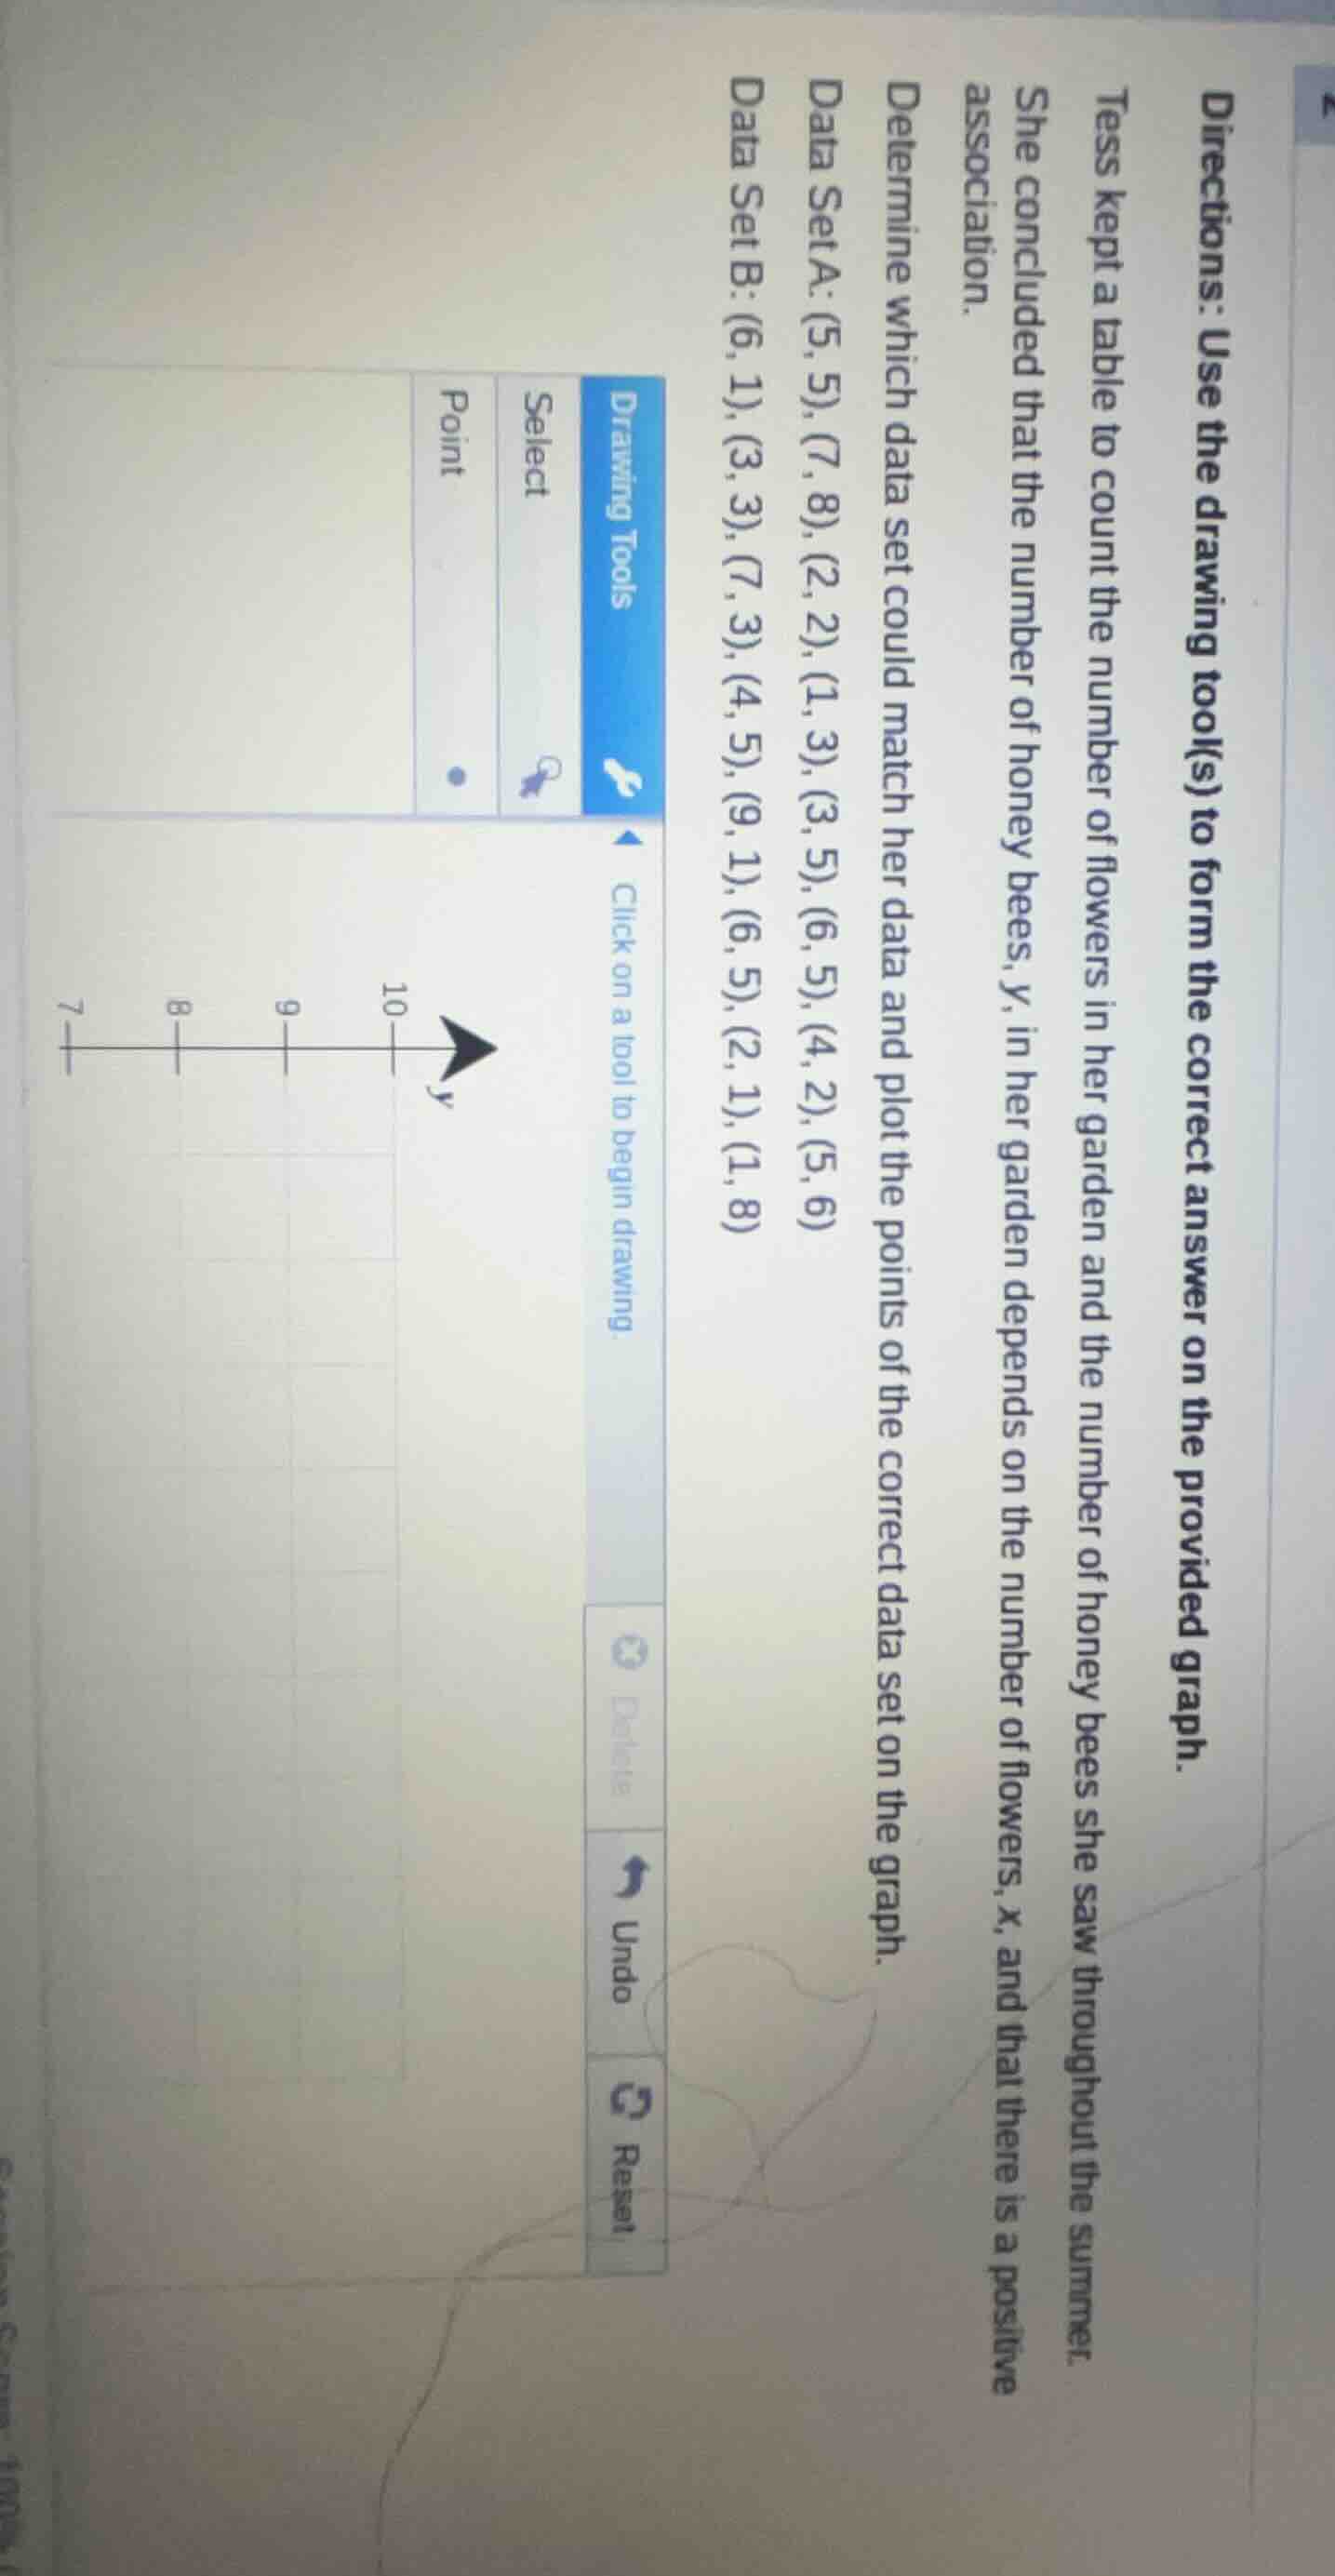
directions: use the drawing tool(s) to form the correct answer on the provided graph.
tess kept a table to count the number of flowers in her garden and the number of honey bees she saw throughout the summer. she concluded that the number of honey bees, y, in her garden depends on the number of flowers, x, and that there is a positive association.
determine which data set could match her data and plot the points of the correct data set on the graph.
data set a: (5, 5), (7, 8), (2, 2), (1, 3), (3, 5), (6, 5), (4, 2), (5, 6)
data set b: (6, 1), (3, 3), (7, 3), (4, 5), (9, 1), (6, 5), (2, 1), (1, 8)
Step1: Identify positive association rule
A positive association means as $x$ (flowers) increases, $y$ (bees) tends to increase.
Step2: Analyze Data Set A
Check trend of $(x,y)$ pairs:
$(1,3), (2,2), (3,5), (4,2), (5,5), (5,6), (6,5), (7,8)$
As $x$ rises, $y$ generally rises (e.g., $x=1,y=3$; $x=7,y=8$).
Step3: Analyze Data Set B
Check trend of $(x,y)$ pairs:
$(1,8), (2,1), (3,3), (4,5), (6,1), (6,5), (7,3), (9,1)$
As $x$ rises, $y$ does not consistently rise (e.g., $x=1,y=8$; $x=9,y=1$).
Step4: Confirm valid data set
Only Data Set A shows positive association.

Snap & solve any problem in the app
Get step-by-step solutions on Sovi AI
Photo-based solutions with guided steps
Explore more problems and detailed explanations
The correct data set is Data Set A, with points to plot: $(1, 3)$, $(2, 2)$, $(3, 5)$, $(4, 2)$, $(5, 5)$, $(5, 6)$, $(6, 5)$, $(7, 8)$