QUESTION IMAGE
Question
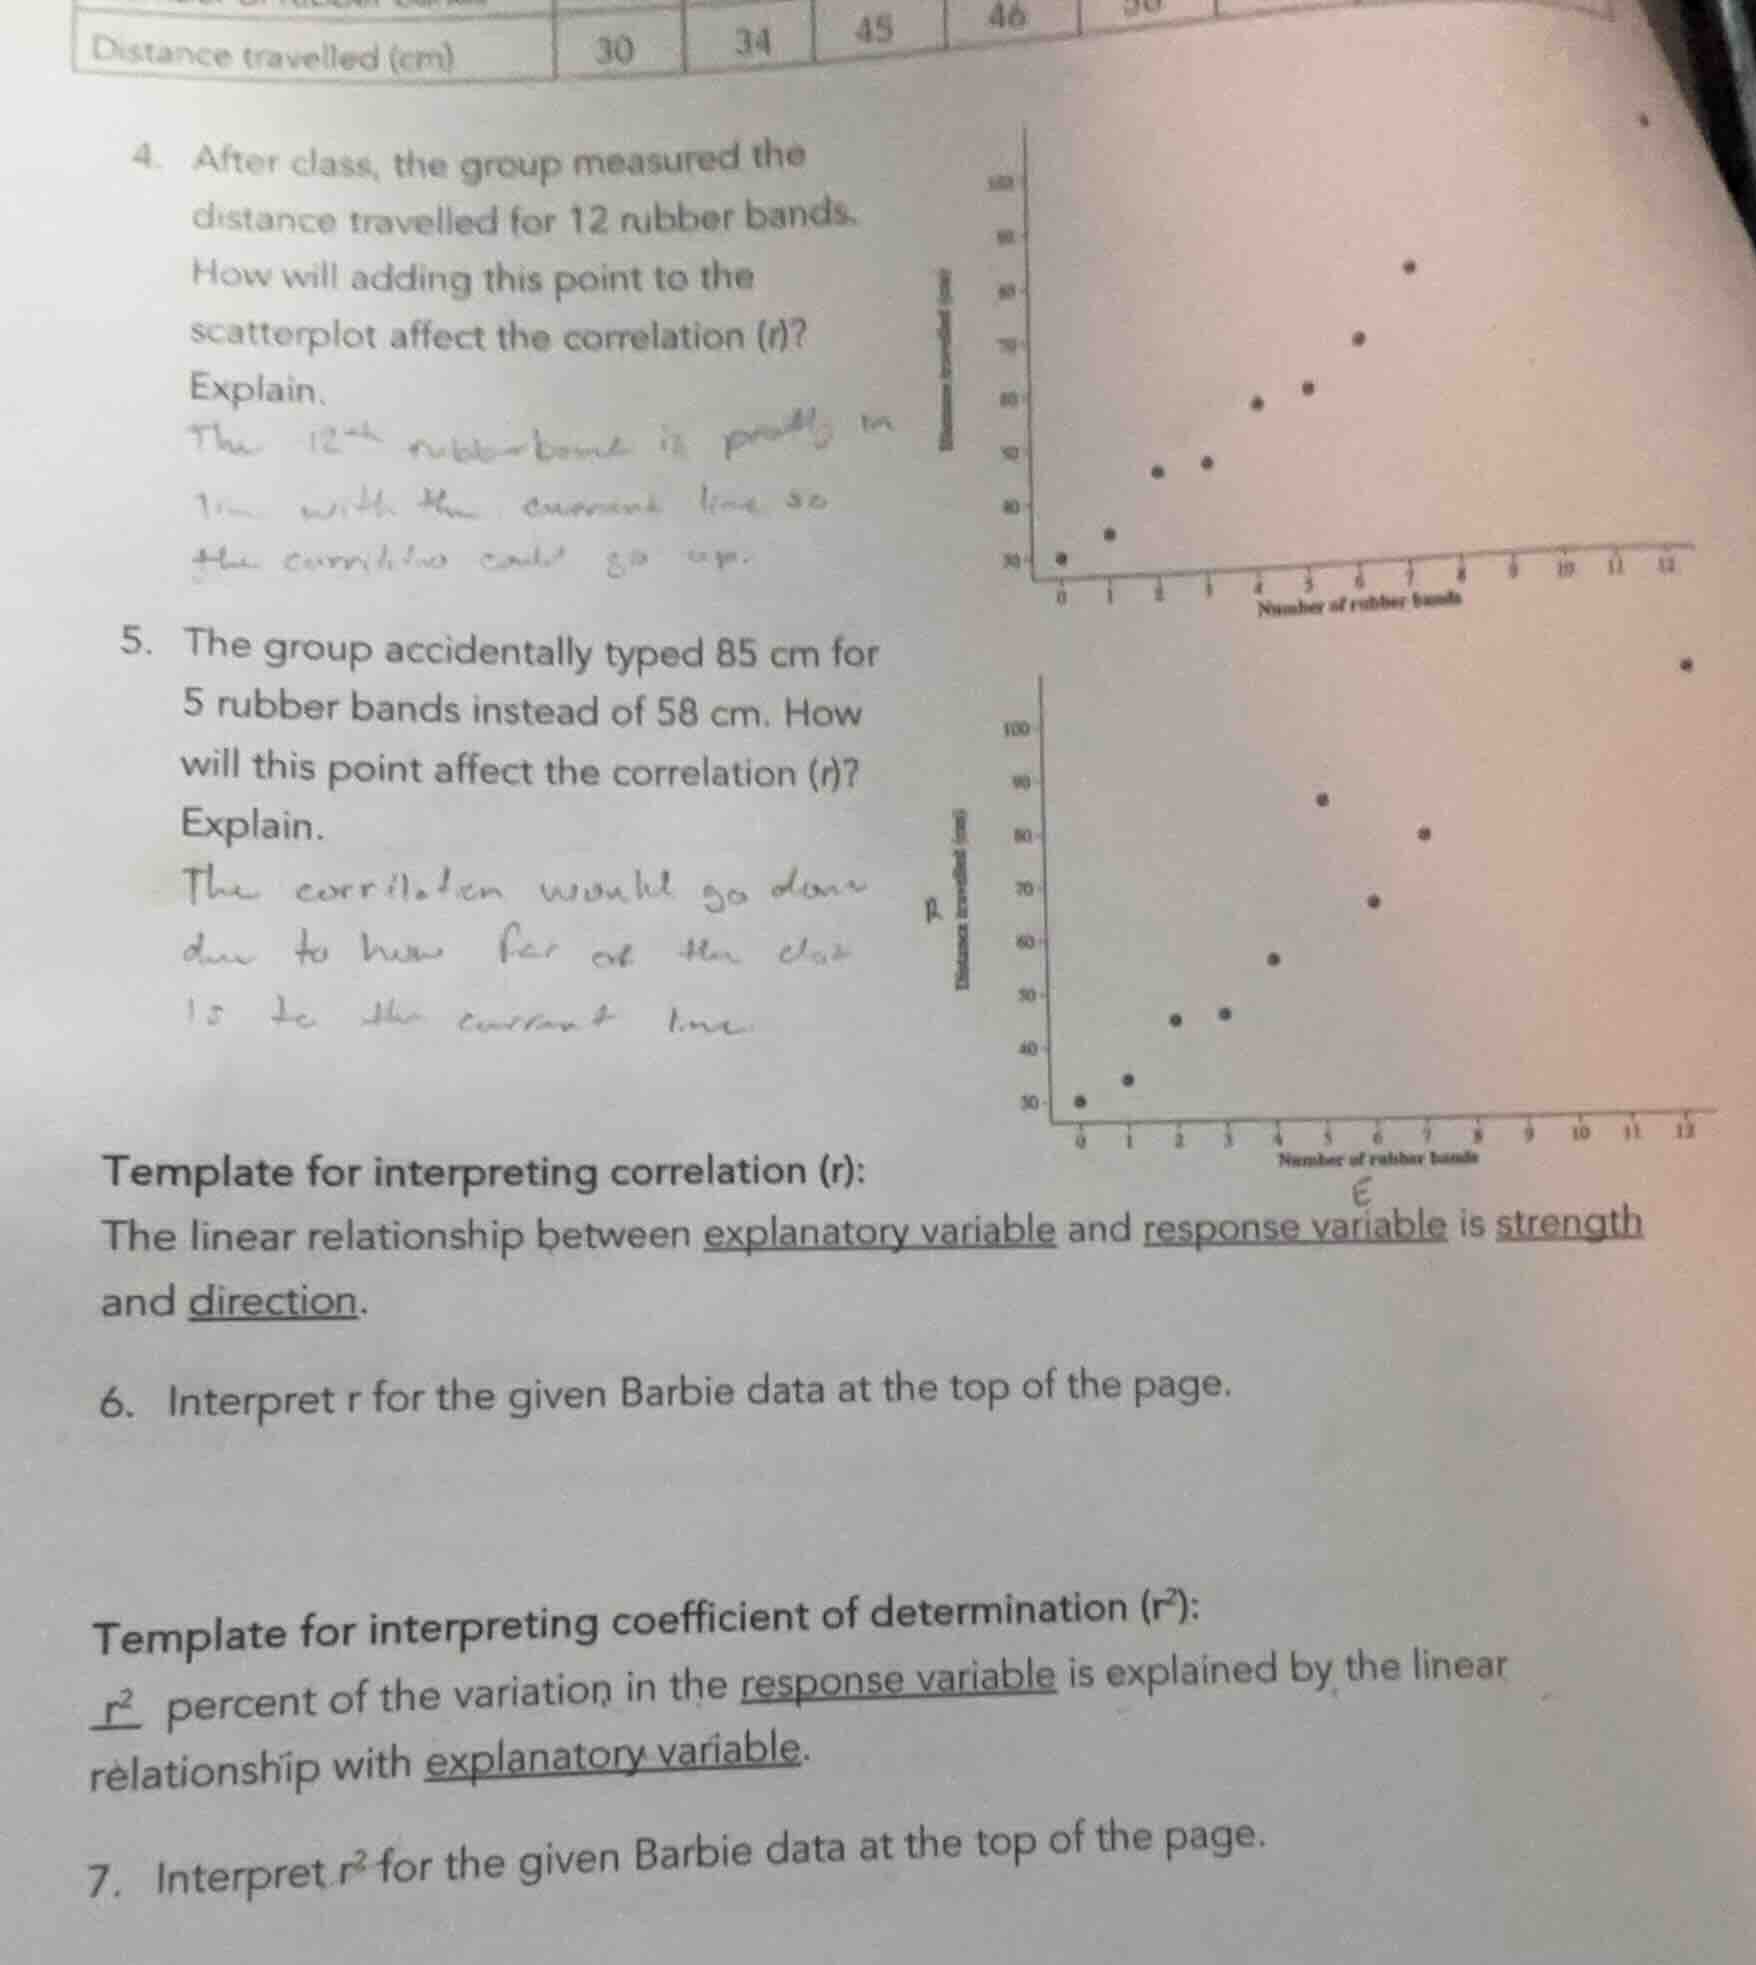
distance travelled (cm) 30 34 45 46
- after class, the group measured the distance travelled for 12 rubber bands. how will adding this point to the scatterplot affect the correlation (r)? explain.
- the group accidentally typed 85 cm for 5 rubber bands instead of 58 cm. how will this point affect the correlation (r)? explain.
template for interpreting correlation (r):
the linear relationship between explanatory variable and response variable is strength and direction.
- interpret r for the given barbie data at the top of the page.
template for interpreting coefficient of determination (r²):
r² percent of the variation in the response variable is explained by the linear relationship with explanatory variable.
- interpret r² for the given barbie data at the top of the page.
For Question 4:
The existing scatterplot shows a strong positive linear trend where more rubber bands correlate with greater distance travelled. A 12 rubber band point that follows this increasing linear pattern (aligning with the trend) will strengthen the positive linear relationship, making the correlation coefficient \(r\) closer to +1.
For Question 5:
The original point for 5 rubber bands was 58 cm, which fits the positive linear trend. Changing it to 85 cm creates an outlier that lies far above the existing linear pattern. This outlier weakens the strength of the positive linear relationship, causing the correlation coefficient \(r\) to decrease (move closer to 0).
For Question 6:
Using the template: The explanatory variable is the number of rubber bands, the response variable is distance travelled (cm). The scatterplot shows a strong, positive linear relationship, so we apply the template to this context.
For Question 7:
First, assume a strong positive \(r\) (e.g., \(r \approx 0.98\), so \(r^2 \approx 0.96\) or 96% - consistent with the strong trend). Using the template, we state the percentage of variation in distance travelled explained by the linear relationship with the number of rubber bands.

Snap & solve any problem in the app
Get step-by-step solutions on Sovi AI
Photo-based solutions with guided steps
Explore more problems and detailed explanations
- Adding this point will increase \(r\) (make it closer to +1), as it follows the strong positive linear trend of the existing data, strengthening the linear relationship.
- Changing the point will decrease \(r\) (make it closer to 0), as the 85 cm value is an outlier that deviates from the positive linear trend, weakening the linear relationship.
- The linear relationship between the number of rubber bands and distance travelled (cm) is strong and positive.
- Approximately 96% of the variation in distance travelled (cm) is explained by the linear relationship with the number of rubber bands.