QUESTION IMAGE
Question
distribution patterns
several basic distribution patterns should be looked for when selecting a bin size, because some situations are known to follow a certain
distribution. the standard bell curve is a unimodal distribution pattern. a unimodal distribution occurs when one mode exists in the
histogram. ex: in histogram-5 above, the 10 – 15 mph bin has the highest frequency of all bins, and thus, is the single mode.
other common distribution patterns are listed below.
- bimodal: contains two prevalent modes
- multimodal: contains multiple prevalent modes
- skewed left: contains a mode on the right with a tail of low - frequency bins on the left
- skewed right: contains a mode on the left with a tail of low - frequency bins on the right
participation
activity 1.8.3 distribution patterns.
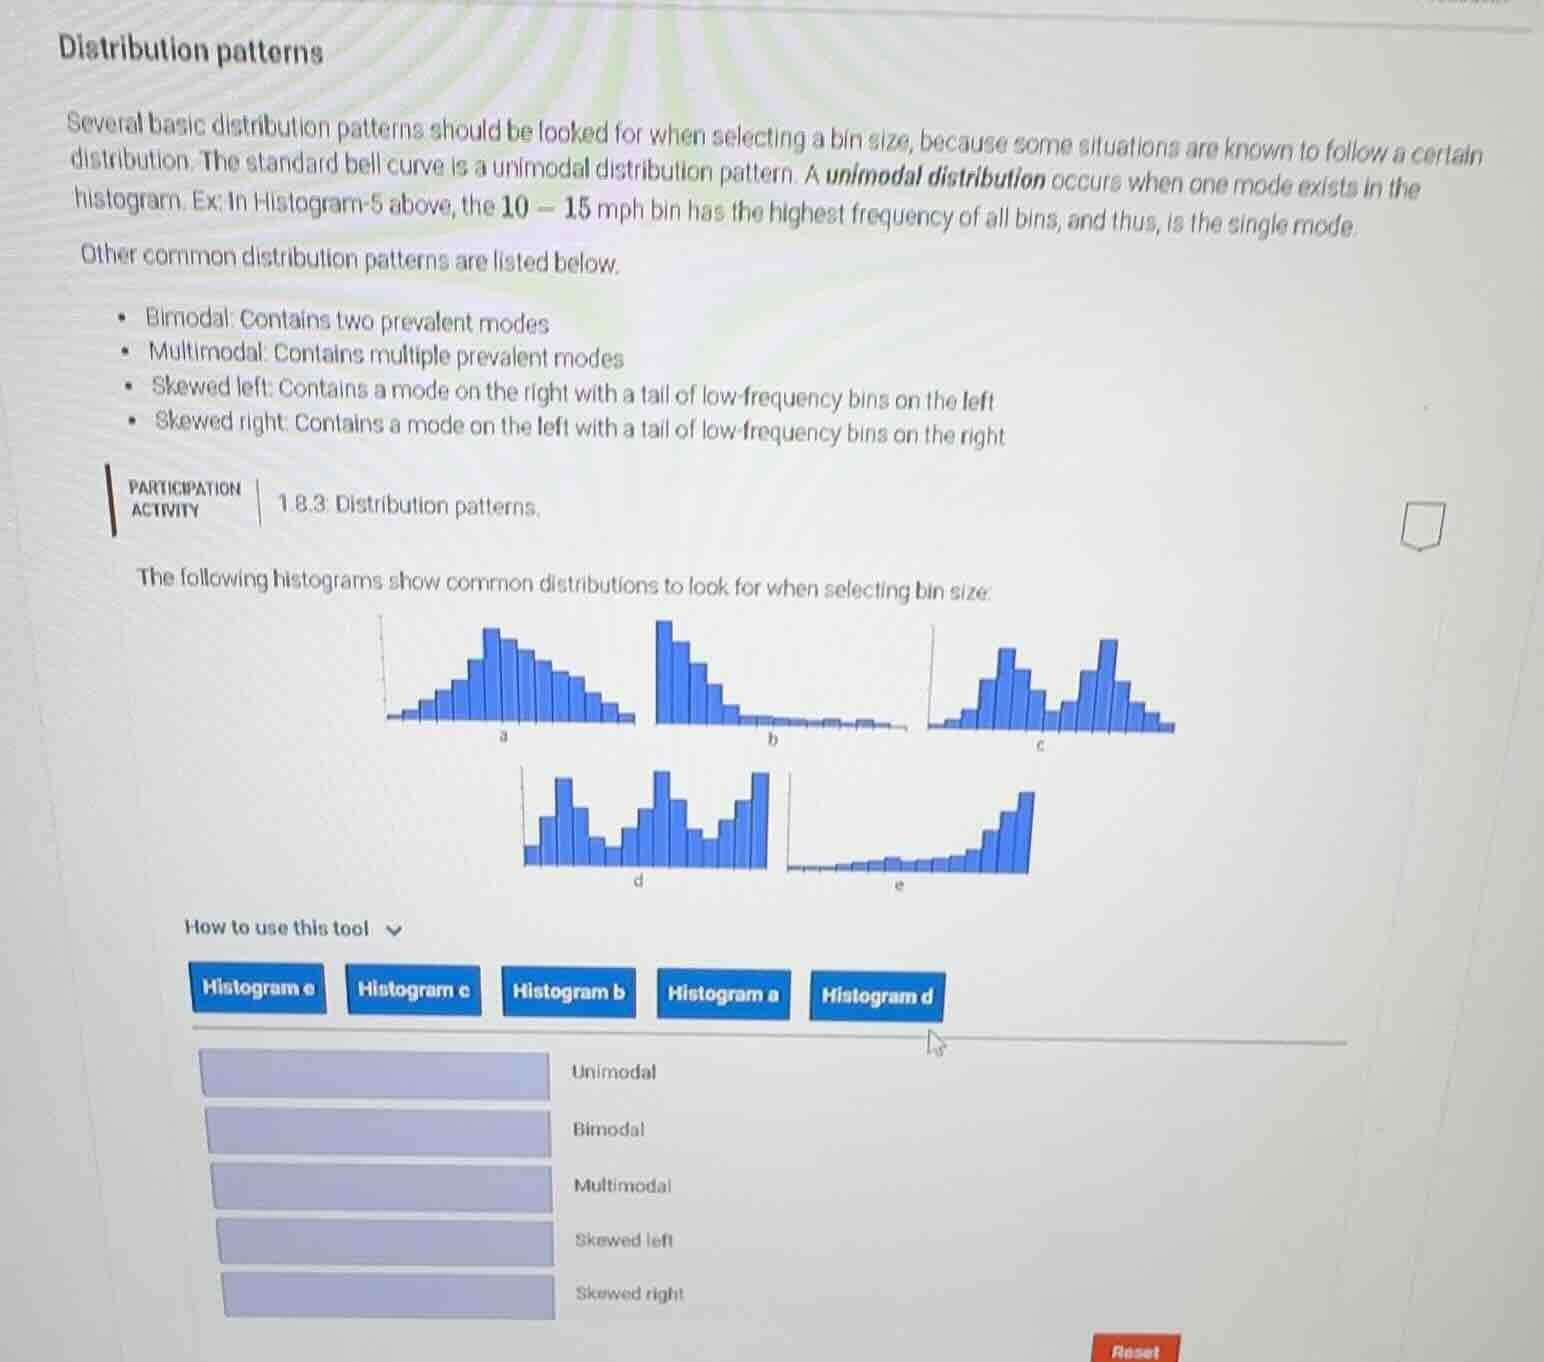
the following histograms show common distributions to look for when selecting bin size:
(there are five histograms labeled a, b, c, d, e)
how to use this tool
histogram e histogram c histogram b histogram a histogram d
unimodal
bimodal
multimodal
skewed left
skewed right

Snap & solve any problem in the app
Get step-by-step solutions on Sovi AI
Photo-based solutions with guided steps
Explore more problems and detailed explanations
Histogram a - Unimodal
Histogram b - Skewed right
Histogram c - Bimodal
Histogram d - Multimodal
Histogram e - Skewed left