QUESTION IMAGE
Question
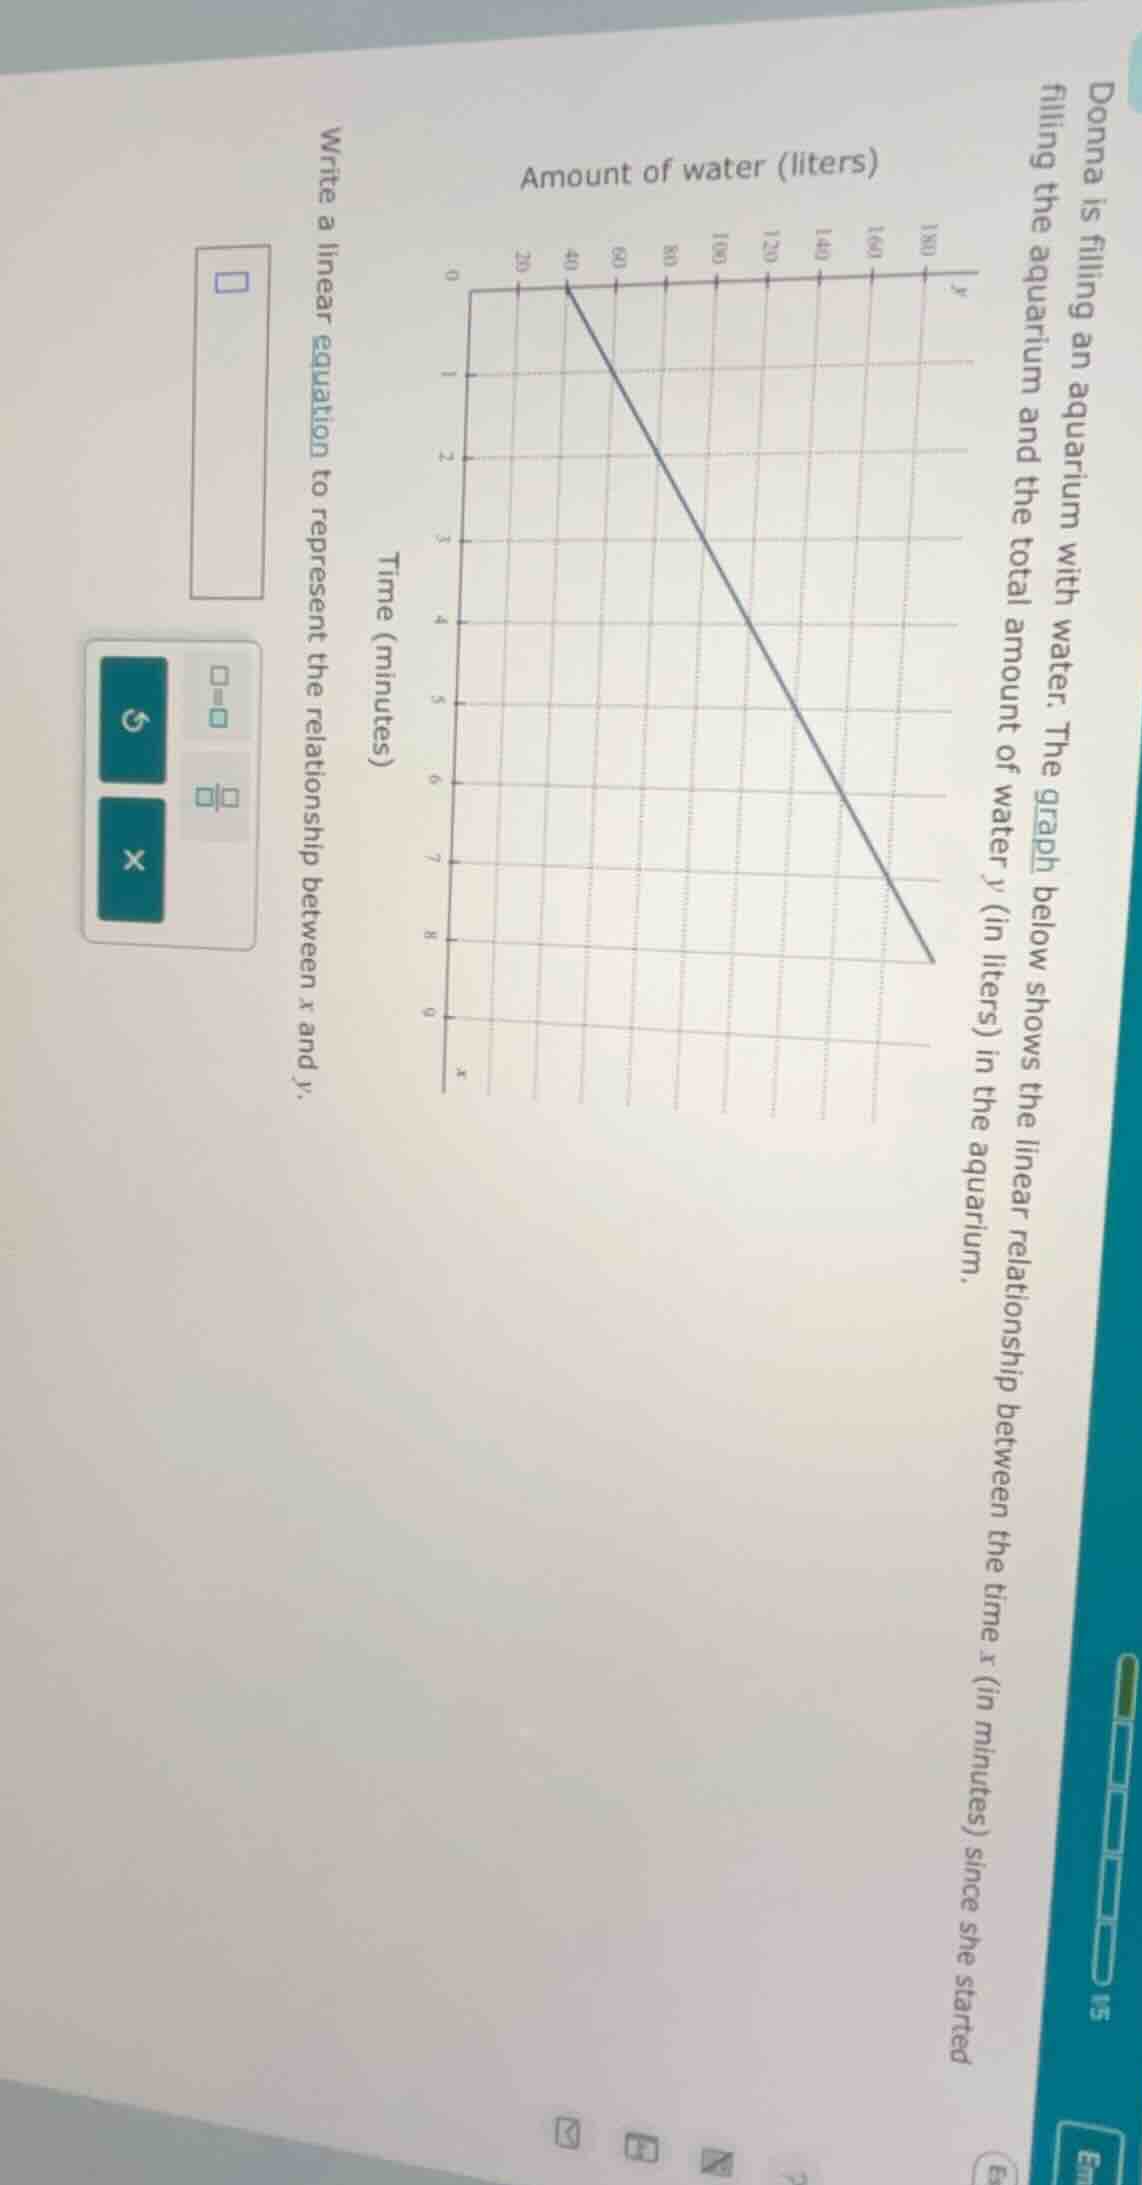
donna is filling an aquarium with water. the graph below shows the linear relationship between the time x (in minutes) since she started filling the aquarium and the total amount of water y (in liters) in the aquarium.
amount of water (liters)
time (minutes)
write a linear equation to represent the relationship between x and y.
Step1: Identify intercept point
The line crosses the y-axis at $(0, 40)$, so the y-intercept $b = 40$.
Step2: Calculate slope
Use points $(0, 40)$ and $(4, 120)$. Slope formula: $m=\frac{y_2-y_1}{x_2-x_1}$
$m=\frac{120-40}{4-0}=\frac{80}{4}=20$
Step3: Write linear equation
Use slope-intercept form $y=mx+b$
Substitute $m=20$ and $b=40$: $y=20x+40$

Snap & solve any problem in the app
Get step-by-step solutions on Sovi AI
Photo-based solutions with guided steps
Explore more problems and detailed explanations
$y=20x+40$