QUESTION IMAGE
Question
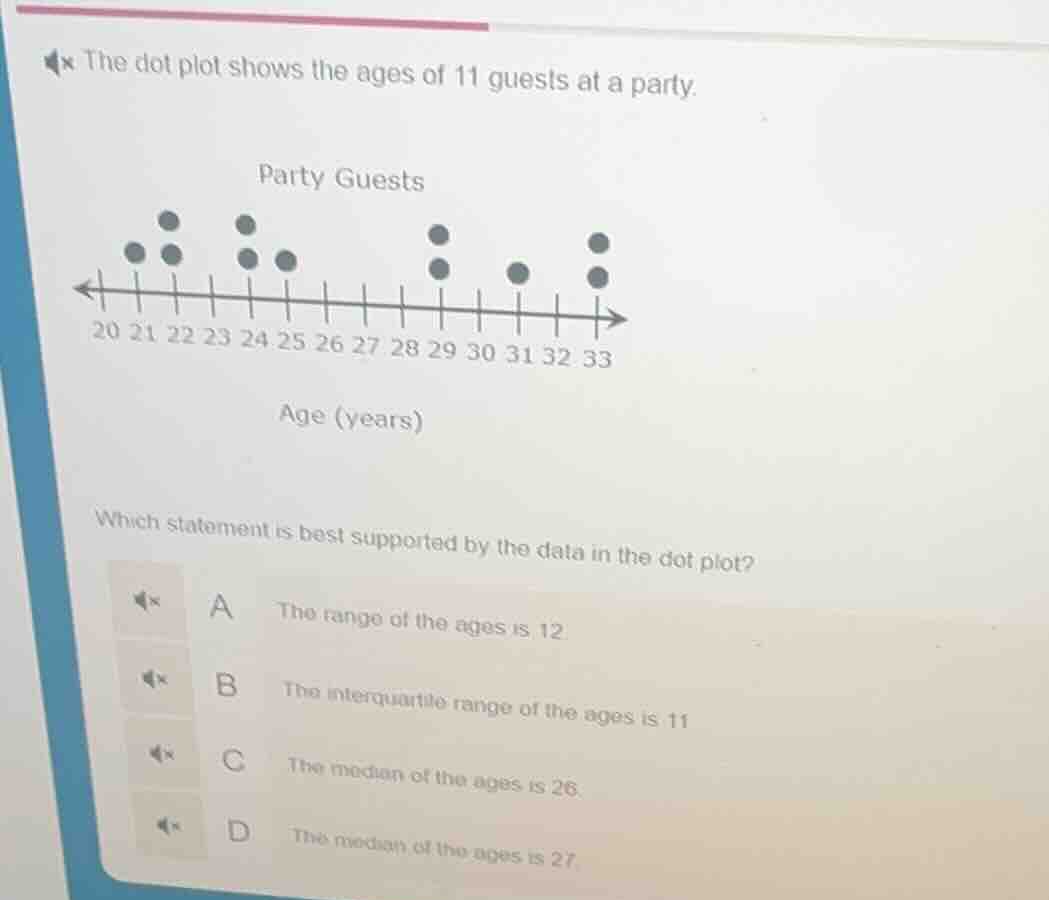
the dot plot shows the ages of 11 guests at a party.
party guests
20 21 22 23 24 25 26 27 28 29 30 31 32 33
age (years)
which statement is best supported by the data in the dot plot?
a the range of the ages is 12.
b the interquartile range of the ages is 11
c the median of the ages is 26.
d the median of the ages is 27.
Step1: List all guest ages
From the dot plot, the ages are: 21, 22, 22, 24, 24, 25, 29, 30, 32, 33, 33
Step2: Calculate range
Range = Max age - Min age
$\text{Range} = 33 - 21 = 12$
Step3: Find median (6th value)
Sorted data: 21, 22, 22, 24, 24, 25, 29, 30, 32, 33, 33
Median = 25
Step4: Calculate interquartile range
Q1 = median of lower half (first 5 values): 22
Q3 = median of upper half (last 5 values): 32
$\text{IQR} = 32 - 22 = 10$
Step5: Verify options
Check each option against calculated values.

Snap & solve any problem in the app
Get step-by-step solutions on Sovi AI
Photo-based solutions with guided steps
Explore more problems and detailed explanations
A. The range of the ages is 12