QUESTION IMAGE
Question
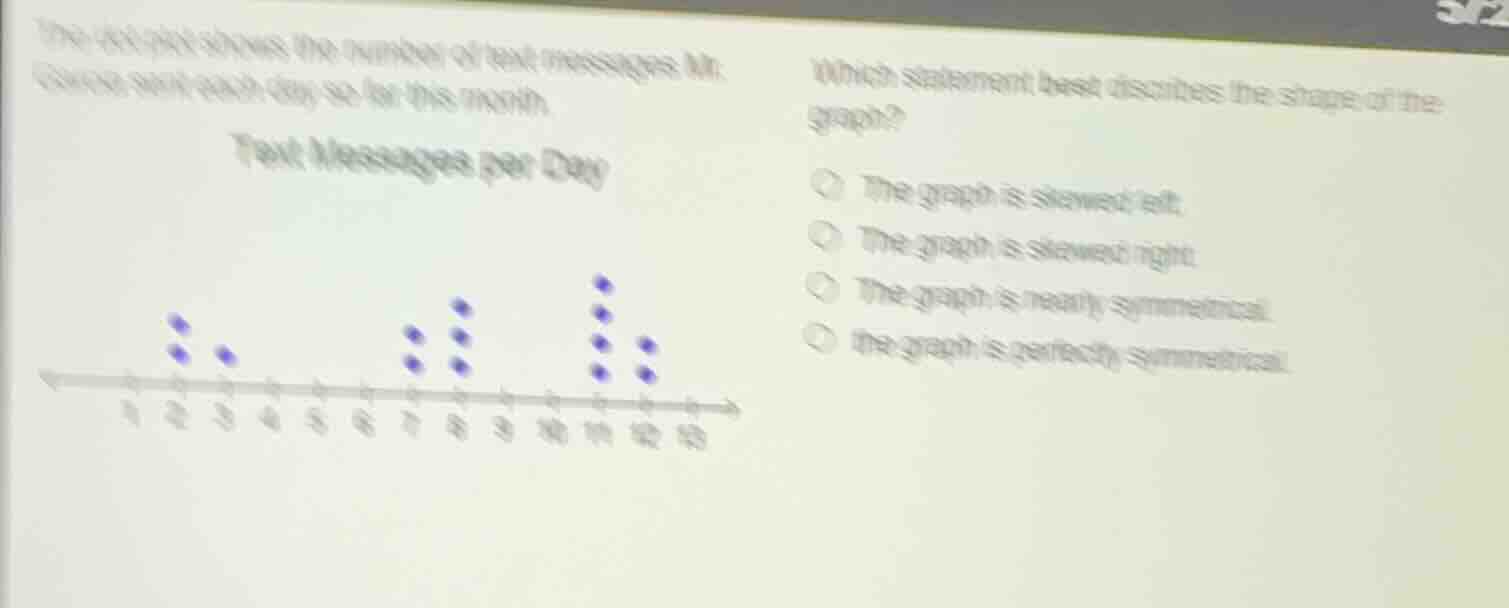
the dot - plot shows the number of text messages mr. garcia sent each day so far this month.
text messages per day
dot - plot with dots at 2 (two dots), 3 (one dot), 7 (two dots), 8 (three dots), 11 (four dots), 12 (two dots)
which statement best describes the shape of the graph?
- the graph is skewed left.
- the graph is skewed right.
- the graph is nearly symmetrical.
- the graph is perfectly symmetrical.
To determine the shape of the dot - plot (a type of graph for representing data), we analyze the distribution of the dots.
- A left - skewed graph has a longer tail on the left side. A right - skewed graph has a longer tail on the right side.
- For a perfectly symmetrical graph, the data would be mirrored exactly on both sides of the center. For a nearly symmetrical graph, the data is roughly balanced around the center, with some minor deviations.
Looking at the dot - plot for the number of text messages per day, the data points are distributed in a way that there is no long tail on either side, and while it may not be a perfect mirror image (so not perfectly symmetrical), it is roughly balanced around the center.

Snap & solve any problem in the app
Get step-by-step solutions on Sovi AI
Photo-based solutions with guided steps
Explore more problems and detailed explanations
The graph is nearly symmetrical.