QUESTION IMAGE
Question
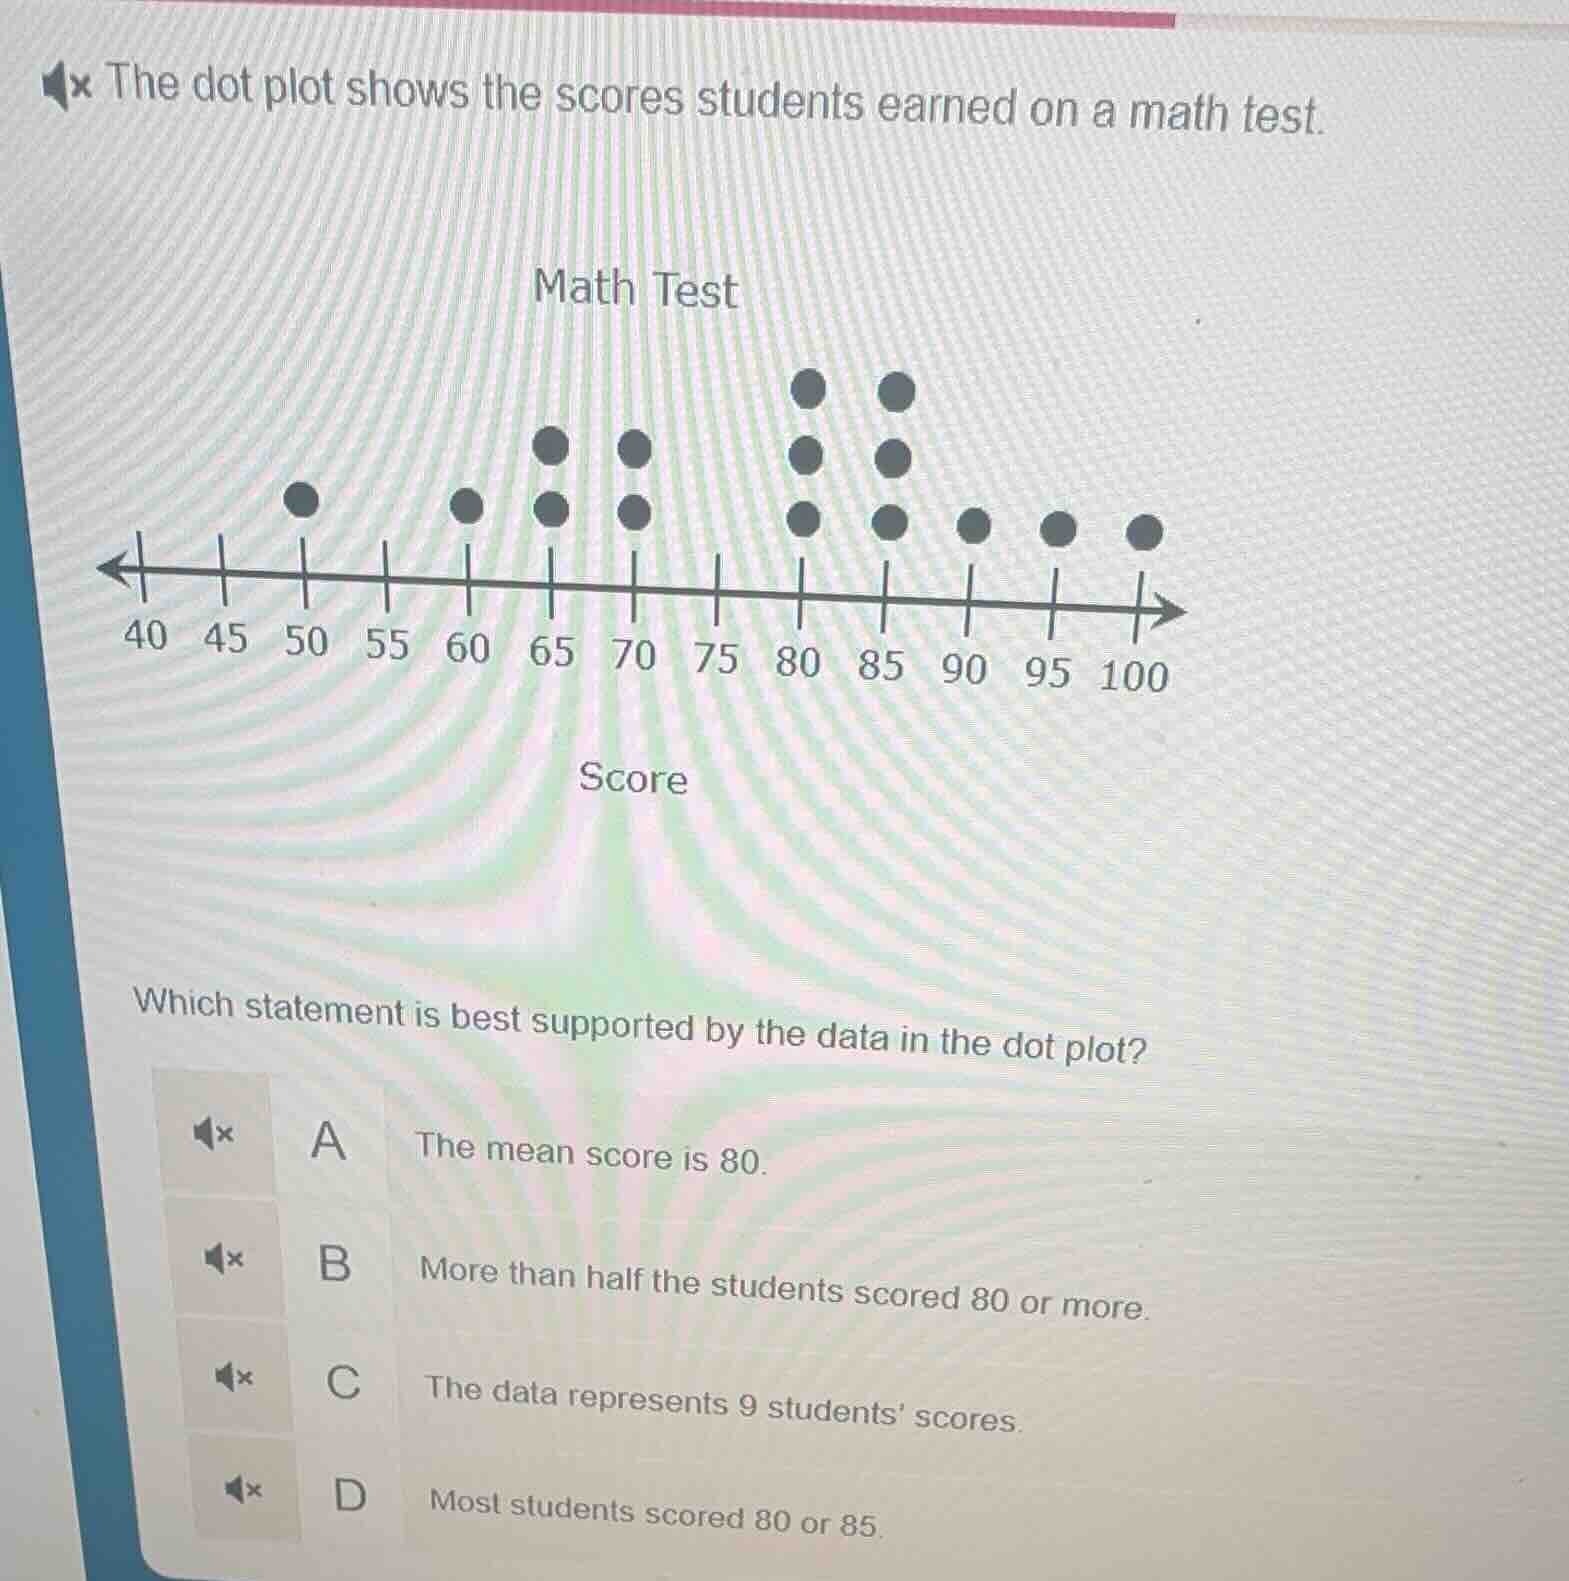
the dot plot shows the scores students earned on a math test. math test (dot plot with scores from 40 to 100, dots as per the plot) which statement is best supported by the data in the dot plot? a the mean score is 80. b more than half the students scored 80 or more. c the data represents 9 students’ scores. d most students scored 80 or 85.
Step1: Count total students
Count all dots: $1+1+2+2+3+3+1+1+1=15$
Step2: Evaluate Option A
Calculate mean: $\frac{50 + 60 + 65*2 + 70*2 + 80*3 + 85*3 + 90 + 95 + 100}{15} = \frac{1150}{15} \approx 76.67$
Step3: Evaluate Option B
Count students with $\geq80$: $3+3+1+1+1=9$. $\frac{9}{15}=0.6$, which is >0.5
Step4: Evaluate Option C
Total students are 15, not 9
Step5: Evaluate Option D
Students with 80/85: $3+3=6$. $\frac{6}{15}=0.4$, which is not most

Snap & solve any problem in the app
Get step-by-step solutions on Sovi AI
Photo-based solutions with guided steps
Explore more problems and detailed explanations
B. More than half the students scored 80 or more.