QUESTION IMAGE
Question
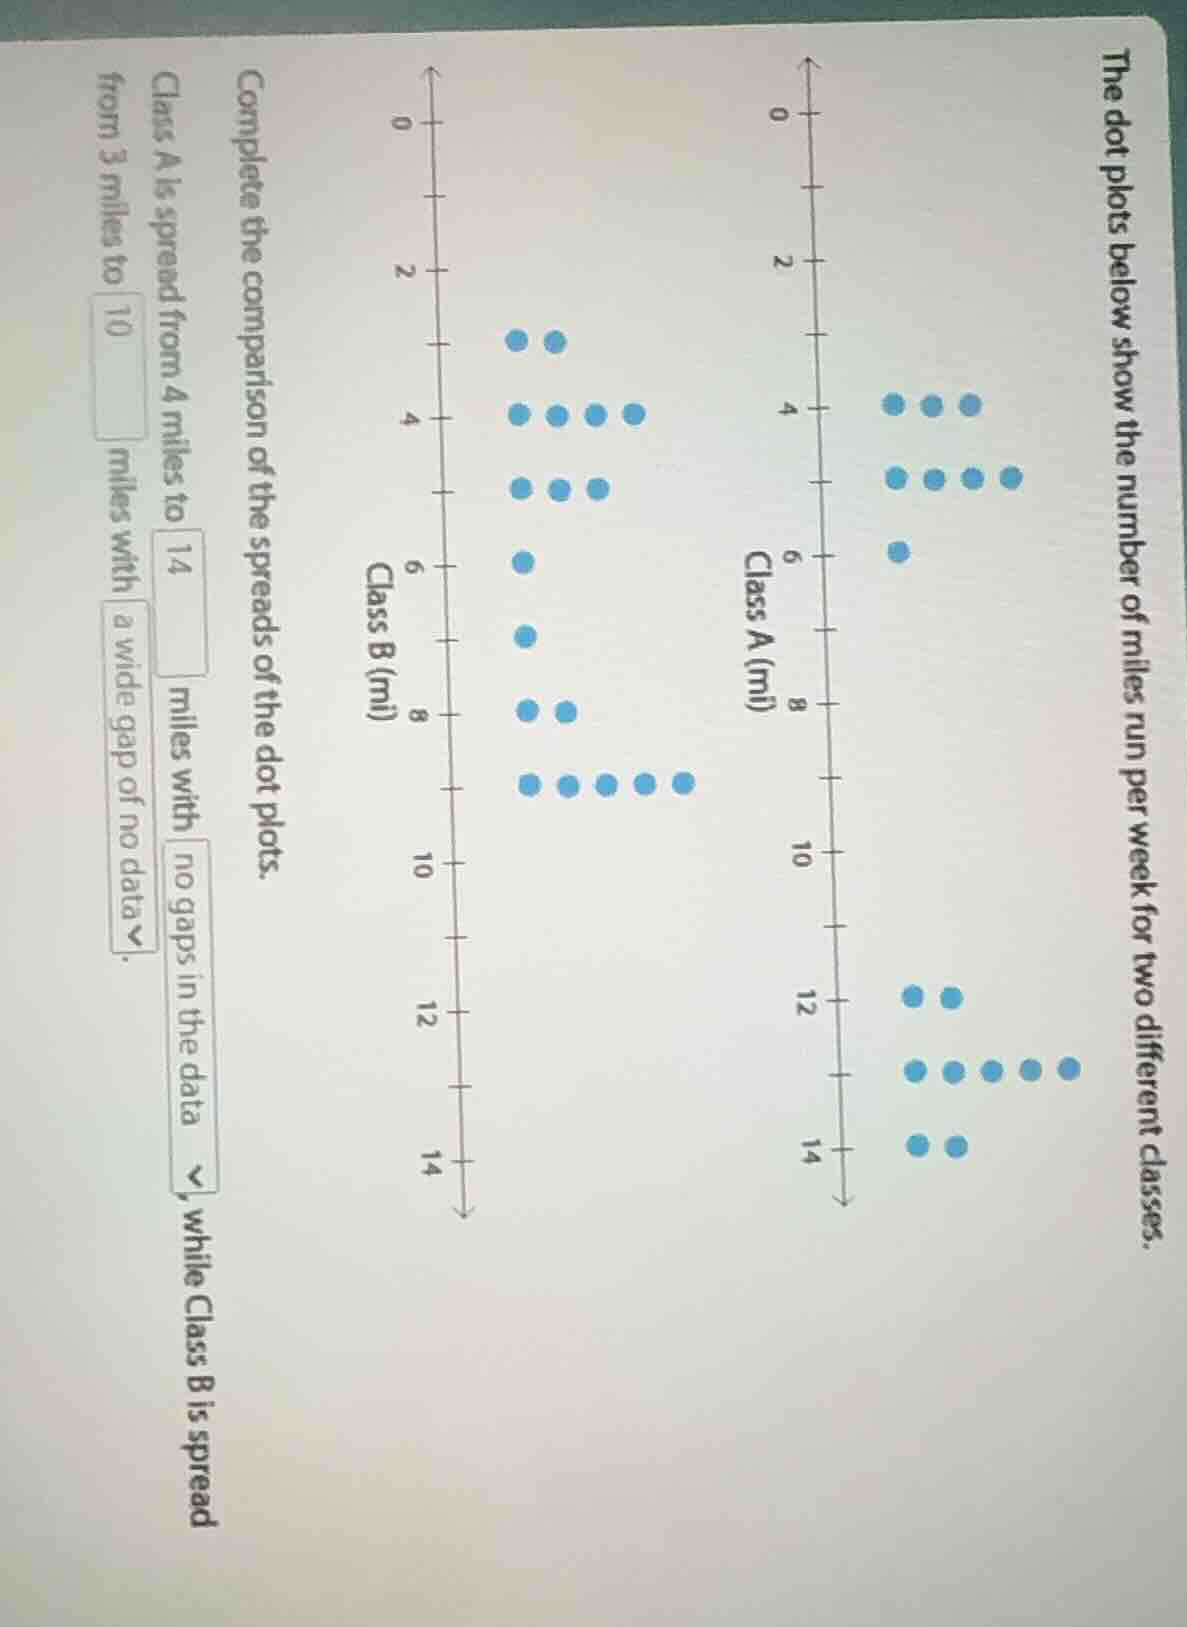
the dot plots below show the number of miles run per week for two different classes.
complete the comparison of the spreads of the dot plots.
class a is spread from 4 miles to \boxed{14} miles with \boxed{no gaps in the data}, while class b is spread from 3 miles to \boxed{10} miles with \boxed{a wide gap of no data}.
Step1: Analyze Class A's data range
Looking at the dot plot for Class A, the minimum value (smallest number of miles) is 4 and the maximum value (largest number of miles) is 14. So the spread is from 4 to 14 miles.
Step2: Analyze Class B's data range
For Class B's dot plot, the minimum value is 3 (from the x - axis labels, the first non - zero data starts around 3? Wait, looking at the plot, the first dots are at 3? Wait no, the x - axis for Class B: the first dots are at 3? Wait the Class B plot: the first dots are at 3? Wait no, looking at the Class B (mi) plot, the x - axis has 0,2,4,6,8,10,12,14. The dots start at 3? Wait no, the first dots are at 3? Wait the first set of dots for Class B is at 3? Wait no, the first dots are at 3? Wait no, looking at the Class B plot: the first dots are at 3? Wait the first dots are at 3? Wait no, the x - axis is labeled 0,2,4,6,8,10,12,14. The first dots for Class B are at 3? Wait no, the first dots are at 3? Wait maybe I misread. Wait the Class A plot: the data points are at 4,5,6,12,13,14? Wait no, looking at Class A (mi) plot: the dots are at 4 (3 dots), 5 (4 dots), 6 (1 dot), 12 (2 dots), 13 (5 dots), 14 (2 dots). Wait no, the x - axis for Class A: 0,2,4,6,8,10,12,14. The dots: at 4 (3), 5 (4), 6 (1), 12 (2), 13 (5), 14 (2). So the minimum is 4, maximum is 14. For Class B (mi) plot: x - axis 0,2,4,6,8,10,12,14. Dots: at 3 (2), 4 (4), 5 (3), 6 (1), 7 (1), 8 (2), 9 (5). Wait no, maybe the x - axis labels are 3,4,5,6,7,8,9? Wait no, the original problem: "Class A (mi)" and "Class B (mi)". Let's re - examine:
For Class A: The dot plot has dots at 4,5,6,12,13,14? Wait no, the first part of Class A (left side) has dots at 4 (3), 5 (4), 6 (1), and then a gap, then dots at 12 (2), 13 (5), 14 (2). So the minimum value is 4, maximum is 14. So the spread is from 4 to 14 miles.
For Class B: The dot plot has dots starting at 3 (2 dots), then 4 (4), 5 (3), 6 (1), 7 (1), 8 (2), 9 (5). Wait no, the x - axis for Class B: 0,2,4,6,8,10,12,14? No, maybe the x - axis is labeled with the number of miles, so the first dot is at 3 miles (since between 2 and 4, the first dot is at 3). Then the maximum is 9? Wait no, the last dots for Class B are at 9? Wait the original problem says "Class B is spread from 3 miles to 10 miles with a wide gap of no data". Wait the second blank for Class A: "Class A is spread from 4 miles to [blank] miles with [blank] in the data". From the Class A plot, the maximum value is 14 (since there are dots at 14). And looking at the data, between 6 and 12, there are no dots (a gap), and then data from 12 to 14. So Class A is spread from 4 to 14 miles with a gap in the data? Wait no, the first blank for Class A: "Class A is spread from 4 miles to \boxed{14} miles with \boxed{a gap} in the data", and Class B is spread from 3 miles to \boxed{10} miles with \boxed{no gap} in the data. Wait the problem's text: "Class A is spread from 4 miles to \underline{14} miles with \underline{a gap} in the data, while Class B is spread from 3 miles to \underline{10} miles with \underline{no gap} in the data."
Wait let's confirm:
- For Class A: The minimum is 4 (first dot at 4), maximum is 14 (last dot at 14). Between 6 and 12, there are no dots (a gap).
- For Class B: The minimum is 3 (first dot at 3), maximum is 10 (last dot at 10), and there are no gaps (dots are continuous from 3 to 10).

Snap & solve any problem in the app
Get step-by-step solutions on Sovi AI
Photo-based solutions with guided steps
Explore more problems and detailed explanations
First blank (Class A max): 14
Second blank (Class A data): a gap
Third blank (Class B max): 10
Fourth blank (Class B data): no gap
(Assuming the blanks are filled as: "Class A is spread from 4 miles to \boldsymbol{14} miles with \boldsymbol{a gap} in the data, while Class B is spread from 3 miles to \boldsymbol{10} miles with \boldsymbol{no gap} in the data.")