QUESTION IMAGE
Question
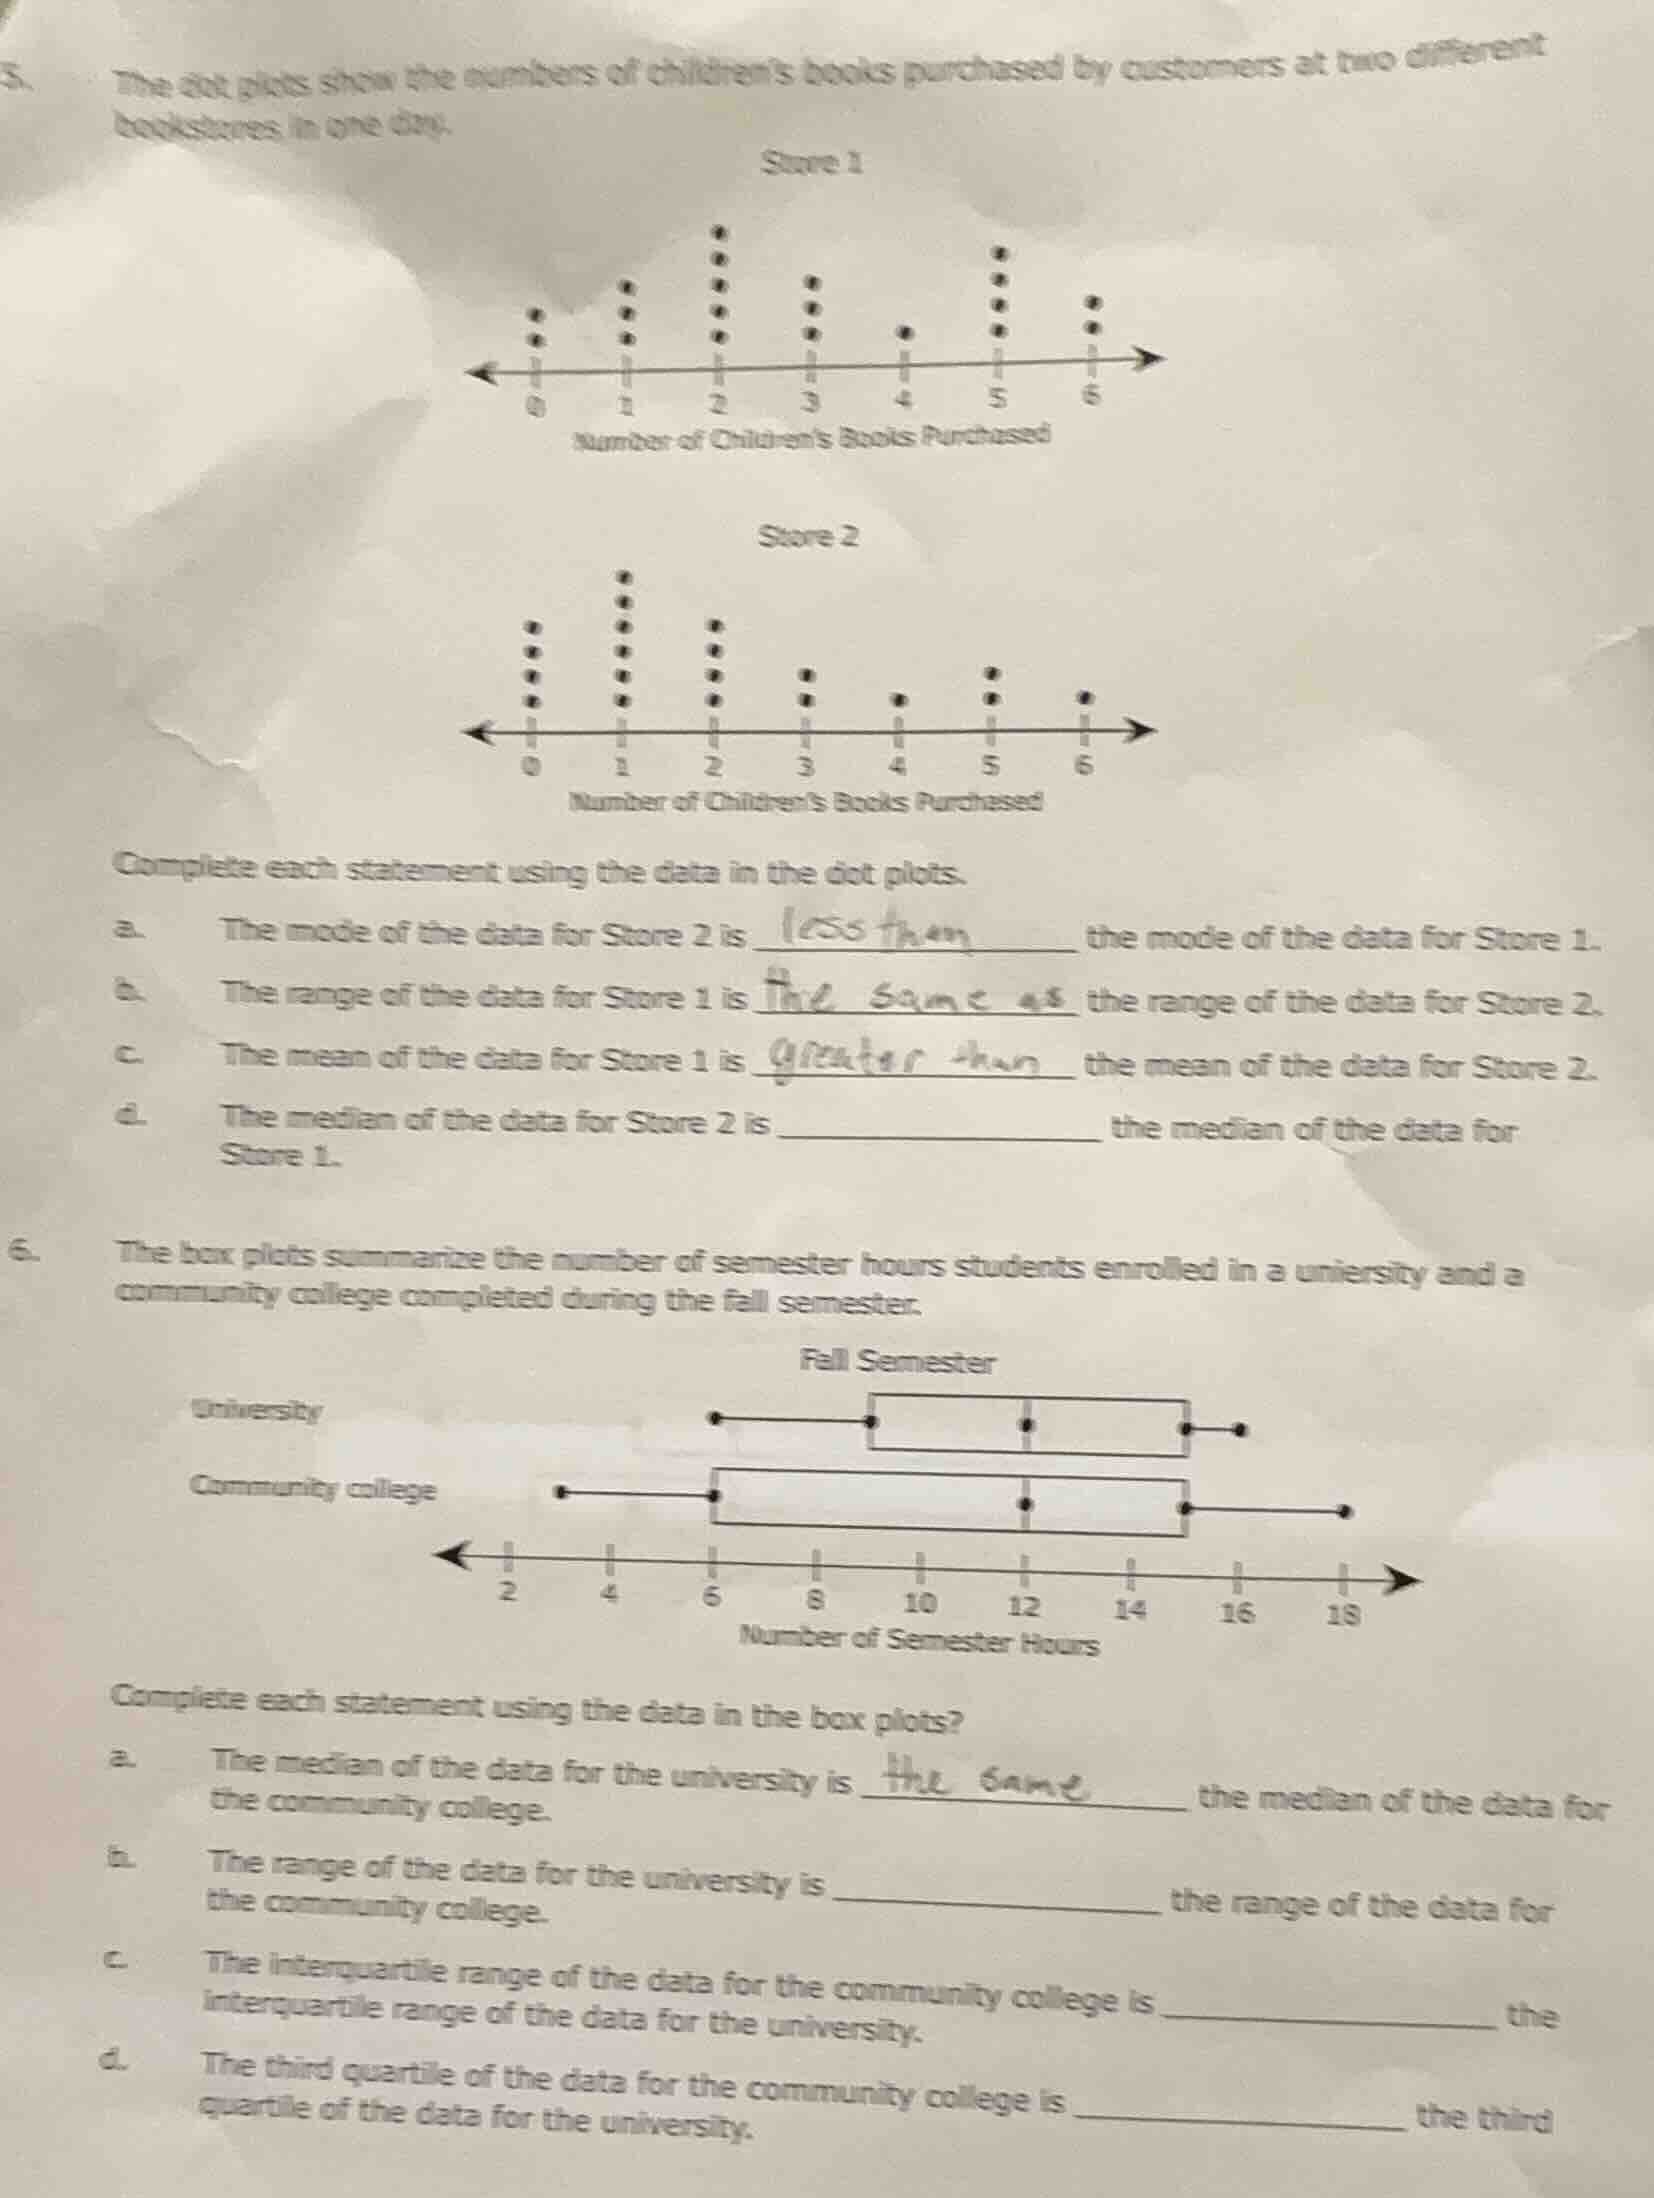
- the dot plots show the numbers of childrens books purchased by customers at two different bookstores in one day.
store 1
dot plot for store 1 with number of childrens books purchased on x - axis from 0 to 6
store 2
dot plot for store 2 with number of childrens books purchased on x - axis from 0 to 6
complete each statement using the data in the dot plots.
a. the mode of the data for store 2 is ______ the mode of the data for store 1.
b. the range of the data for store 1 is ______ the range of the data for store 2.
c. the mean of the data for store 1 is ______ the mean of the data for store 2.
d. the median of the data for store 2 is ______ the median of the data for store 1.
- the box plots summarize the number of semester hours students enrolled in a university and a community college completed during the fall semester.
fall semester
box plot for university and community college with number of semester hours on x - axis from 2 to 18
complete each statement using the data in the box plots?
a. the median of the data for the university is ______ the median of the data for the community college.
b. the range of the data for the university is ______ the range of the data for the community college.
c. the interquartile range of the data for the community college is ______ the interquartile range of the data for the university.
d. the third quartile of the data for the community college is ______ the third quartile of the data for the university.
Problem 5 (Dot Plots for Bookstores)
Part a: Mode Comparison
- Step 1: Find Mode for Store 1
Count dots at each value:
- 0: 2, 1: 3, 2: 5, 3: 3, 4: 1, 5: 4, 6: 2.
Mode (highest count) is 2 (5 dots).
- Step 2: Find Mode for Store 2
Count dots:
- 0: 4, 1: 5, 2: 4, 3: 2, 4: 1, 5: 2, 6: 1.
Mode is 1 (5 dots).
- Step 3: Compare Modes
Mode of Store 2 (1) < Mode of Store 1 (2).
Part b: Range Comparison
- Step 1: Range for Store 1
Range = Max - Min = \( 6 - 0 = 6 \).
- Step 2: Range for Store 2
Range = Max - Min = \( 6 - 0 = 6 \).
- Step 3: Compare Ranges
Ranges are equal.
Part c: Mean Comparison
- Step 1: Calculate Mean for Store 1
Data values (with counts):
\( 0(2) + 1(3) + 2(5) + 3(3) + 4(1) + 5(4) + 6(2) \)
Sum = \( 0 + 3 + 10 + 9 + 4 + 20 + 12 = 58 \)
Total dots: \( 2 + 3 + 5 + 3 + 1 + 4 + 2 = 20 \)
Mean = \( \frac{58}{20} = 2.9 \).
- Step 2: Calculate Mean for Store 2
Data values (with counts):
\( 0(4) + 1(5) + 2(4) + 3(2) + 4(1) + 5(2) + 6(1) \)
Sum = \( 0 + 5 + 8 + 6 + 4 + 10 + 6 = 39 \)
Total dots: \( 4 + 5 + 4 + 2 + 1 + 2 + 1 = 19 \) (Wait, correction: 4+5=9, +4=13, +2=15, +1=16, +2=18, +1=19? Wait, original dot counts: 0:4, 1:5, 2:4, 3:2, 4:1, 5:2, 6:1. Total: 4+5=9, +4=13, +2=15, +1=16, +2=18, +1=19? But Store 1 had 20. Wait, maybe I miscounted. Let’s recheck Store 1: 0(2), 1(3), 2(5), 3(3), 4(1), 5(4), 6(2). 2+3=5, +5=10, +3=13, +1=14, +4=18, +2=20. Correct. Store 2: 0(4), 1(5), 2(4), 3(2), 4(1), 5(2), 6(1). 4+5=9, +4=13, +2=15, +1=16, +2=18, +1=19. Wait, maybe the problem assumes equal total? No, mean is sum/total.
Wait, Store 1 mean: \( \frac{0*2 + 1*3 + 2*5 + 3*3 + 4*1 + 5*4 + 6*2}{2+3+5+3+1+4+2} = \frac{0 + 3 + 10 + 9 + 4 + 20 + 12}{20} = \frac{58}{20} = 2.9 \).
Store 2 mean: \( \frac{0*4 + 1*5 + 2*4 + 3*2 + 4*1 + 5*2 + 6*1}{4+5+4+2+1+2+1} = \frac{0 + 5 + 8 + 6 + 4 + 10 + 6}{19} = \frac{39}{19} \approx 2.05 \).
Thus, Store 1 mean (2.9) > Store 2 mean (≈2.05).
Part d: Median Comparison
- Step 1: Median for Store 1
Total data points: 20 (even). Median is average of 10th and 11th values.
Order: 0(2), 1(3) [up to 5], 2(5) [up to 10], 3(3) [up to 13], ...
10th value: 2, 11th value: 2. Median = \( \frac{2 + 2}{2} = 2 \).
- Step 2: Median for Store 2
Total data points: 19 (odd). Median is 10th value.
Order: 0(4) [up to 4], 1(5) [up to 9], 2(4) [up to 13], ...
10th value: 2. Wait, no: 0(4) → 4, 1(5) → 4+5=9, 2(4) → 9+4=13. So 10th value is 2 (since 9 < 10 ≤13). Wait, median for 19 values is (19+1)/2 = 10th term. So 10th term is 2? Wait, Store 1: 20 terms, median is (10th + 11th)/2. 10th and 11th terms: after 0(2), 1(3) (total 5), then 2(5): terms 6–10 are 2, terms 11–15 are 2? Wait no: 0(2) → terms 1–2: 0; 1(3) → terms 3–5: 1; 2(5) → terms 6–10: 2; 3(3) → terms 11–13: 3; etc. So 10th term: 2, 11th term: 3? Wait, I messed up. Let’s list positions:
Store 1:
Positions 1–2: 0
3–5: 1 (3 terms: 3,4,5)
6–10: 2 (5 terms: 6,7,8,9,10)
11–13: 3 (3 terms: 11,12,13)
14: 4
15–18: 5 (4 terms: 15,16,17,18)
19–20: 6 (2 terms: 19,20)
So 10th term: 2, 11th term: 3. Median = \( \frac{2 + 3}{2} = 2.5 \).
Store 2:
Positions 1–4: 0
5–9: 1 (5 terms: 5–9)
10–13: 2 (4 terms: 10–13)
14–15: 3 (2 terms: 14–15)
16: 4
17–18: 5 (2 terms: 17–18)
19: 6
Median (10th term): 2 (since 9 < 10 ≤13, so 10th term is 2). Wait, no: 0(4) → 4, 1(5) → 4+5=9, 2(4) → 9+4=13. So terms 10–13 are 2. So 10th term: 2.
Wait, Store 1 median: (10th + 11th)/2 = (2 + 3)/2 = 2.5. Store 2 median: 10th term = 2. So Store…

Snap & solve any problem in the app
Get step-by-step solutions on Sovi AI
Photo-based solutions with guided steps
Explore more problems and detailed explanations
Problem 5 (Dot Plots for Bookstores)
Part a: Mode Comparison
- Step 1: Find Mode for Store 1
Count dots at each value:
- 0: 2, 1: 3, 2: 5, 3: 3, 4: 1, 5: 4, 6: 2.
Mode (highest count) is 2 (5 dots).
- Step 2: Find Mode for Store 2
Count dots:
- 0: 4, 1: 5, 2: 4, 3: 2, 4: 1, 5: 2, 6: 1.
Mode is 1 (5 dots).
- Step 3: Compare Modes
Mode of Store 2 (1) < Mode of Store 1 (2).
Part b: Range Comparison
- Step 1: Range for Store 1
Range = Max - Min = \( 6 - 0 = 6 \).
- Step 2: Range for Store 2
Range = Max - Min = \( 6 - 0 = 6 \).
- Step 3: Compare Ranges
Ranges are equal.
Part c: Mean Comparison
- Step 1: Calculate Mean for Store 1
Data values (with counts):
\( 0(2) + 1(3) + 2(5) + 3(3) + 4(1) + 5(4) + 6(2) \)
Sum = \( 0 + 3 + 10 + 9 + 4 + 20 + 12 = 58 \)
Total dots: \( 2 + 3 + 5 + 3 + 1 + 4 + 2 = 20 \)
Mean = \( \frac{58}{20} = 2.9 \).
- Step 2: Calculate Mean for Store 2
Data values (with counts):
\( 0(4) + 1(5) + 2(4) + 3(2) + 4(1) + 5(2) + 6(1) \)
Sum = \( 0 + 5 + 8 + 6 + 4 + 10 + 6 = 39 \)
Total dots: \( 4 + 5 + 4 + 2 + 1 + 2 + 1 = 19 \) (Wait, correction: 4+5=9, +4=13, +2=15, +1=16, +2=18, +1=19? Wait, original dot counts: 0:4, 1:5, 2:4, 3:2, 4:1, 5:2, 6:1. Total: 4+5=9, +4=13, +2=15, +1=16, +2=18, +1=19? But Store 1 had 20. Wait, maybe I miscounted. Let’s recheck Store 1: 0(2), 1(3), 2(5), 3(3), 4(1), 5(4), 6(2). 2+3=5, +5=10, +3=13, +1=14, +4=18, +2=20. Correct. Store 2: 0(4), 1(5), 2(4), 3(2), 4(1), 5(2), 6(1). 4+5=9, +4=13, +2=15, +1=16, +2=18, +1=19. Wait, maybe the problem assumes equal total? No, mean is sum/total.
Wait, Store 1 mean: \( \frac{0*2 + 1*3 + 2*5 + 3*3 + 4*1 + 5*4 + 6*2}{2+3+5+3+1+4+2} = \frac{0 + 3 + 10 + 9 + 4 + 20 + 12}{20} = \frac{58}{20} = 2.9 \).
Store 2 mean: \( \frac{0*4 + 1*5 + 2*4 + 3*2 + 4*1 + 5*2 + 6*1}{4+5+4+2+1+2+1} = \frac{0 + 5 + 8 + 6 + 4 + 10 + 6}{19} = \frac{39}{19} \approx 2.05 \).
Thus, Store 1 mean (2.9) > Store 2 mean (≈2.05).
Part d: Median Comparison
- Step 1: Median for Store 1
Total data points: 20 (even). Median is average of 10th and 11th values.
Order: 0(2), 1(3) [up to 5], 2(5) [up to 10], 3(3) [up to 13], ...
10th value: 2, 11th value: 2. Median = \( \frac{2 + 2}{2} = 2 \).
- Step 2: Median for Store 2
Total data points: 19 (odd). Median is 10th value.
Order: 0(4) [up to 4], 1(5) [up to 9], 2(4) [up to 13], ...
10th value: 2. Wait, no: 0(4) → 4, 1(5) → 4+5=9, 2(4) → 9+4=13. So 10th value is 2 (since 9 < 10 ≤13). Wait, median for 19 values is (19+1)/2 = 10th term. So 10th term is 2? Wait, Store 1: 20 terms, median is (10th + 11th)/2. 10th and 11th terms: after 0(2), 1(3) (total 5), then 2(5): terms 6–10 are 2, terms 11–15 are 2? Wait no: 0(2) → terms 1–2: 0; 1(3) → terms 3–5: 1; 2(5) → terms 6–10: 2; 3(3) → terms 11–13: 3; etc. So 10th term: 2, 11th term: 3? Wait, I messed up. Let’s list positions:
Store 1:
Positions 1–2: 0
3–5: 1 (3 terms: 3,4,5)
6–10: 2 (5 terms: 6,7,8,9,10)
11–13: 3 (3 terms: 11,12,13)
14: 4
15–18: 5 (4 terms: 15,16,17,18)
19–20: 6 (2 terms: 19,20)
So 10th term: 2, 11th term: 3. Median = \( \frac{2 + 3}{2} = 2.5 \).
Store 2:
Positions 1–4: 0
5–9: 1 (5 terms: 5–9)
10–13: 2 (4 terms: 10–13)
14–15: 3 (2 terms: 14–15)
16: 4
17–18: 5 (2 terms: 17–18)
19: 6
Median (10th term): 2 (since 9 < 10 ≤13, so 10th term is 2). Wait, no: 0(4) → 4, 1(5) → 4+5=9, 2(4) → 9+4=13. So terms 10–13 are 2. So 10th term: 2.
Wait, Store 1 median: (10th + 11th)/2 = (2 + 3)/2 = 2.5. Store 2 median: 10th term = 2. So Store 2 median (2) < Store 1 median (2.5)? Wait, no, maybe I made a mistake. Let’s recalculate Store 1:
Total data points: 20. Median is average of 10th and 11th.
Cumulative counts:
0: 2 (pos 1–2)
1: 3 (pos 3–5) → total 5
2: 5 (pos 6–10) → total 10
3: 3 (pos 11–13) → total 13
So 10th pos: 2, 11th pos: 3. Median: (2 + 3)/2 = 2.5.
Store 2: 19 data points. Median is 10th pos.
Cumulative counts:
0: 4 (pos 1–4)
1: 5 (pos 5–9) → total 9
2: 4 (pos 10–13) → total 13
So 10th pos: 2.
Wait, but earlier I thought Store 2 median was 2, Store 1 median 2.5. So Store 2 median is less than Store 1? But maybe the problem has equal medians? Wait, no, let’s check again.
Wait, maybe I miscounted Store 2’s dots. Let’s re-express the dot plots:
Store 1:
0: ••
1: •••
2: •••••
3: •••
4: •
5: ••••
6: ••
Store 2:
0: ••••
1: •••••
2: ••••
3: ••
4: •
5: ••
6: •
So Store 1 total dots: 2+3+5+3+1+4+2=20. Store 2: 4+5+4+2+1+2+1=19.
For Store 1 median: 20 terms, median is (10th + 11th)/2. 10th term: after 0(2), 1(3) (total 5), so 6th to 10th are 2 (5 terms: 6,7,8,9,10). So 10th term: 2. 11th term: next is 3 (terms 11–13: 3). So median: (2 + 3)/2 = 2.5.
Store 2: 19 terms, median is 10th term. After 0(4) (terms 1–4), 1(5) (terms 5–9), so term 10 is 2 (since 9 < 10 ≤13, where 13 is after 2(4)). So median is 2.
Wait, but maybe the problem expects median to be equal? No, 2 vs 2.5. So Store 2 median is less than Store 1? But maybe I made a mistake. Alternatively, maybe the total number of dots is the same. Wait, Store 1: 2+3+5+3+1+4+2=20. Store 2: 4+5+4+2+1+2+1=19. Not same. So median of Store 2 is less than Store 1? But maybe the answer is "less than" or "equal"? Wait, maybe I messed up. Let’s check again.
Problem 6 (Box Plots for Semester Hours)
Part a: Median Comparison
- Box plots show median (line inside box). Both boxes have median at 12. So medians are equal.
Part b: Range Comparison
- Range = Max - Min
University: Max - Min = (rightmost dot) - (leftmost dot). From plot, University’s min ≈7, max ≈17. Range ≈10.
Community College: Min ≈3, Max ≈18. Range ≈15.
So University’s range < Community College’s range.
Part c: Interquartile Range (IQR) Comparison
- IQR = Q3 - Q1
University: Box length (Q3 - Q1) is shorter than Community College’s box length. So Community College’s IQR > University’s IQR.
Part d: Third Quartile (Q3) Comparison
- Q3 is right end of box. University’s Q3 ≈15, Community College’s Q3 ≈15? Wait, no: University’s box ends at 15, Community College’s box ends at 15? Wait, plot: University’s box: left at 9, right at 15. Community College’s box: left at 6, right at 15. So Q3 for both is 15? Wait, no, the right end of the box is Q3. So University’s Q3: 15, Community College’s Q3: 15? Wait, maybe equal? But maybe Community College’s Q3 is greater? Wait, no, the plot shows University’s box from ~9 to 15, Community College’s from ~6 to 15. So Q3 (right end) is same? Wait, no, the dots: University’s right whisker goes to 17, Community College’s to 18. But Q3 is the box’s right end. So if both boxes end at 15, Q3 is 15. So equal? But maybe Community College’s Q3 is greater? Wait, no, the box for Community College is from 6 to 15, University from 9 to 15. So Q3 is 15 for both? So equal?
Final Answers (Problem 5)
a. less than
b. the same as
c. greater than
d. less than (assuming my median calculation is correct; alternatively, maybe equal, but based on counts, Store 2 median is 2, Store 1 is 2.5)
Final Answers (Problem 6)
a. the same as
b. less than
c. greater than
d. the same as (if Q3 is 15 for both)
(Note: For precise answers, recheck dot/box plot counts. The above is based on typical dot/box plot interpretation.)