QUESTION IMAGE
Question
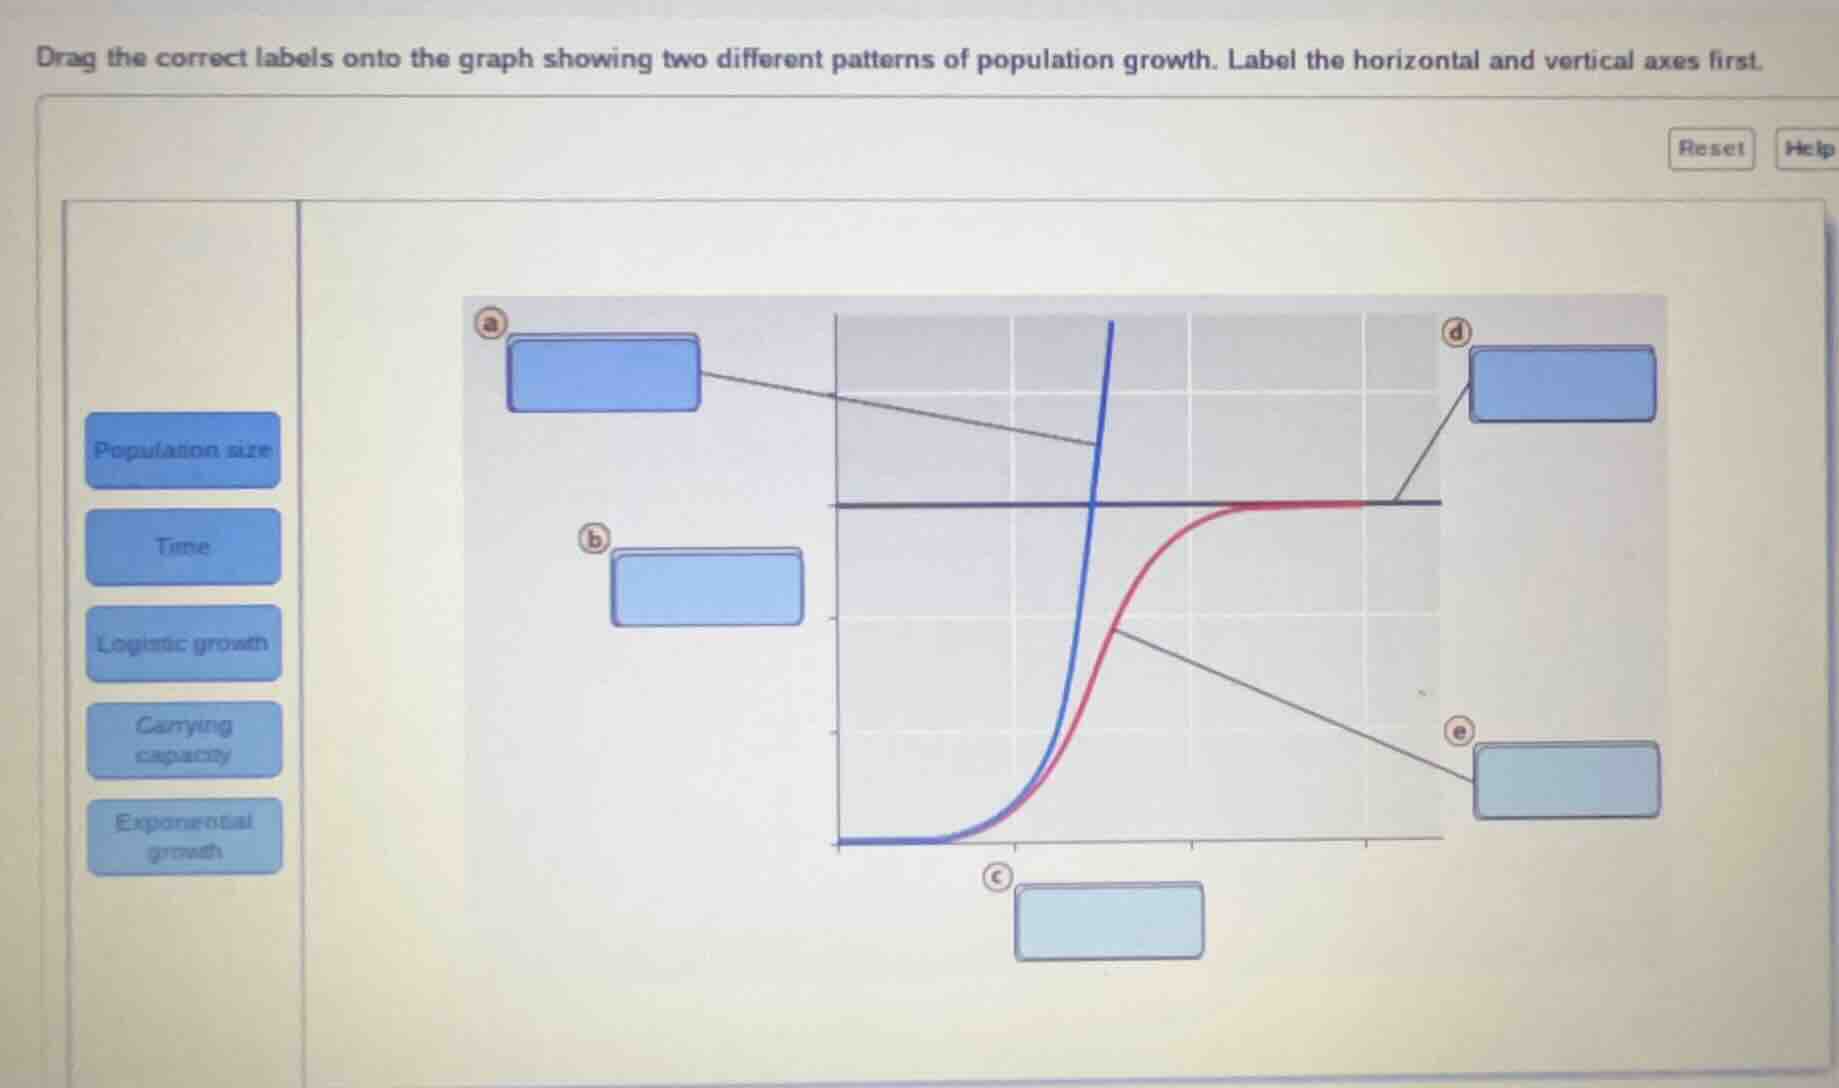
drag the correct labels onto the graph showing two different patterns of population growth. label the horizontal and vertical axes first.
Brief Explanations
- Axes Labels: Population growth graphs always plot time (the independent variable) on the horizontal (x) axis, and population size (the dependent variable) on the vertical (y) axis.
- Growth Curves: The blue curve shows unlimited, accelerating growth, which is exponential growth. The red curve levels off at a maximum value, which is the pattern of logistic growth.
- Carrying Capacity: The horizontal line that the logistic growth curve approaches is the carrying capacity, the maximum sustainable population size for the environment.

Snap & solve any problem in the app
Get step-by-step solutions on Sovi AI
Photo-based solutions with guided steps
Explore more problems and detailed explanations
- a: Population size
- b: Time
- c: Exponential growth
- d: Carrying capacity
- e: Logistic growth